Dizzion Overwatch - Session Analytics - Telemetry
Network and Streaming
Network and Streaming telemetry data is captured by default every second
Average QP
QP (Quantization Parameter) is a measure of the amount of compression applied when H.264 encodes a frame. Low QP = less compression → higher image quality → more bandwidth used. High QP = more compression → lower image quality → less bandwidth used. Average QP shows the overall balance between quality and bandwidth. A lower Average QP means the session looks sharper and cleaner, while a higher QP means the system saves bandwidth by compressing more aggressively.
Estimated Bandwidth
Estimated Bandwidth in FRP/WebRTC shows how much network capacity the connection currently has to send audio and video. WebRTC continuously measures the network and adjusts quality on the fly. If bandwidth drops, it lowers resolution or increases compression to smooth the session. If bandwidth increases, quality automatically improves.
Framerate
Framerate (frames per second, or FPS) shows how many images are sent per second in a video stream.
Max Video Quantization
Max Video Quantization shows the maximum compression applied to any frame during the session.
Network Latency
Network Latency measures the time it takes for data to travel between your device (using a browser or Frame App) and the Workload VM remote system — usually shown in milliseconds (ms).
Jitter
Jitter measures the consistency of the network connection — specifically, how much the delay (latency) varies between packets. Even if average latency is low, high jitter means packets arrive at uneven intervals, which can cause stutters, lag spikes, or audio dropouts in a WebRTC session. Jitter = how “steady” your network connection is. Lower jitter = smoother, more stable experience.
Packet loss
Packet Loss shows the percentage of data packets that never reach their destination during transmission.
System Health
Default Captured: every 15 seconds
- CPU (%)
- Disk Free Space (%)
- Disk Read (%)
- Disk Write (%)
- Memory (%)
- Network Receive (bps)
- Network Sent (bps)
Windows User Login Performance Timeline
Captured: once at user login
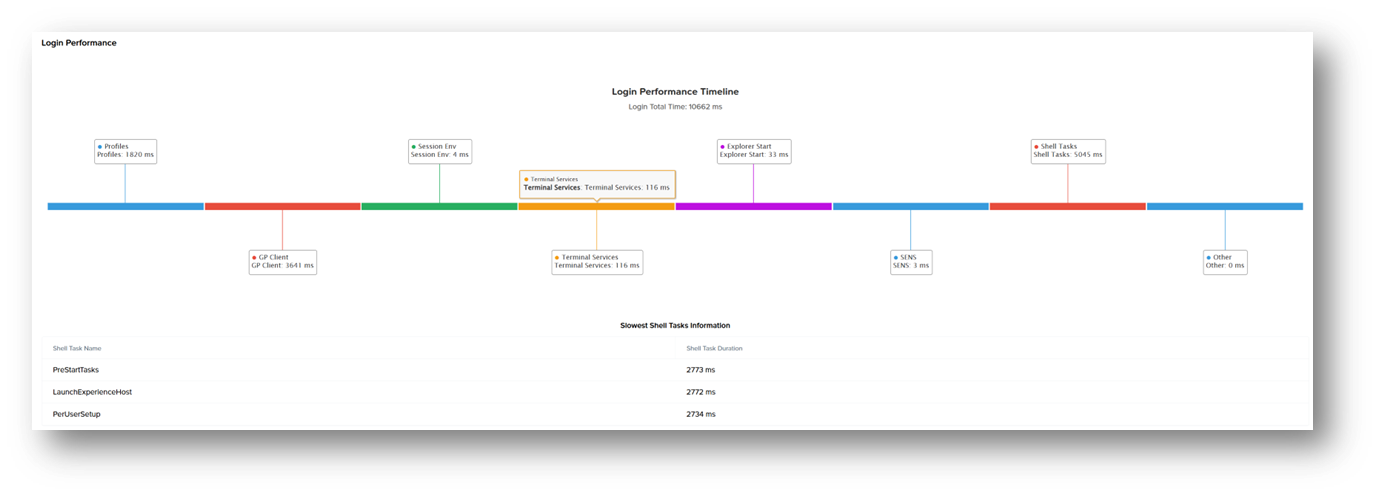
Profiles
User Profile Service – loads user profile (Local/Roaming/FSlogix/Frame Enterprise Profiles)
GP Client
Applies machine and user Group Policies via gpsvc
Note: Many GPOs (especially with scripts or WMI filters) slow logon. Each policy extension adds serial time.
Session Env
Prepares the user’s environment — registry, variables, language packs, fonts, etc
Note: Slow scripts or drive mappings delay this phase. Misconfigured printers or unavailable servers can hang logon.
Terminal Service
Establishes the session layer for RDP or remoting protocols. (N/A for FRP)
Explorer Start
Launches the user shell (explorer.exe).
Note: Startup apps, shell extensions, and context menu handlers delay desktop readiness. Third-party agents (AV, monitoring, OneDrive, Teams AutoStart) often extend this phase.
SENS (System Event Notification Service)
Signals system and application services that the user has logged in
Note: Notifies dependent services (e.g., Task Scheduler, Network Location Awareness, etc.).Used by apps that auto-launch “on logon” events.
Shell Tasks
Executes post-logon initialization tasks inside the shell.
Note: Runs background tasks from Run, Startup, and RunOnce registry keys. Starts tray icons, syncs clients, antivirus UI, updates agents, etc.
Other
Everything else not classified above.
Note: Security audits, custom scripts or third-party logon agents. Delayed background processes
Application Performance
Default Captured: every 17 seconds
- CPU (%)
- Disk (Disk Read and Disk Write) (ops)
- Memory (mbps)
- Network (TCP recv and TCP sent) (bps)