Dizzion Overwatch - Session Analytics - Overview
Dizzion Overwatch is the built-in, always-on observability and analytics layer for Dizzion DaaS and Cloud PC. Overwatch gives IT admins a digital compass and real-time map, enabling deeper visibility, faster diagnostics, more intelligent planning, and more confident decisions to continue delivering the best user experience.
How is Dizzion Overwatch different from other DEX solutions
Digital Employee Experience (DEX) tools deliver observability and analytics, but they come with trade-offs: third-party licensing, integration complexity, additional backend infrastructure, and costs that grow as your user base scales. Dizzion Overwatch, a solution in the DEX ecosystem, takes a fundamentally different approach. It is built into the platform itself as a native service. That means no extra infrastructure costs, firewall changes, or additional agents or installations. It meets compliance requirements, is simple to use, and delivers the observability and analytics needed for DaaS and Cloud PC without the overhead or additional costs.
So, with Overwatch, there are no third-party DEX tools required (like AWS and ControlUp), no extra paid add-on services (like Microsoft with AVD & Cloud PC), and no external data platforms or databases to license, deploy, or manage (like Citrix or Omnissa). With Overwatch, observability and analytics are built in — native, cost-efficient, and ready to use.
What makes overwatch different from other DEX solutions?
Modern design and no additional costs
The Overwatch agent is embedded directly into every DaaS and Cloud PC Windows Workload VM, persistent and non-persistent applications, and desktops. As part of the Dizzion backplane it automatically capturing a wealth of telemetry each second without needing additional agent installation or configuration.
No infrastructure required
Forget Splunk, databases, homegrown dashboards, or juggling load balancers, firewalls, and connectors. Overwatch is powered by Dizzion’s multi-region, multi-zone backplane and streams directly into a fully managed data lake. Our architecture is designed for scale, resilience, and compliance from day one. Instead of deploying infrastructure, maintaining stacks, or worrying about version drift across agents and connectors, Overwatch delivers observability as a native service.
Analytics built into a single admin dashboard
The analytics layer provides real-time insights and actionable intelligence without operational overhead. What you get is a single, always-on observability layer, at this moment optimized for DaaS and Cloud PC. This layer scales with your environment and provides confidence that you’re seeing exactly what’s happening across your DaaS and Cloud PC workloads and users, wherever they are, all within the modern and fresh admin dashboard.
Deep insights, powerful analytics
Telemetry data is captured every second, transmitted, and stored for multiple months into Dizzion’s cloud-native backplane, which resides in the US or EU per customer choice. It is governed by controls and audit logs, including customers' ability to opt out of using Dizzion Overwatch. Telemetry includes workload VM system health, Frame Remoting Protocol (FRP) streaming performance, Windows login experience, application performance, and user experience score.

Workload VM System Health
Overwatch captures workload VM core system metrics such as CPU usage, memory consumption, disk I/O, and inbound/outbound network throughput. These provide immediate visibility into bottlenecks such as resource exhaustion, runaway processes, or under-allocated VMs, allowing IT teams to act before users feel the impact.
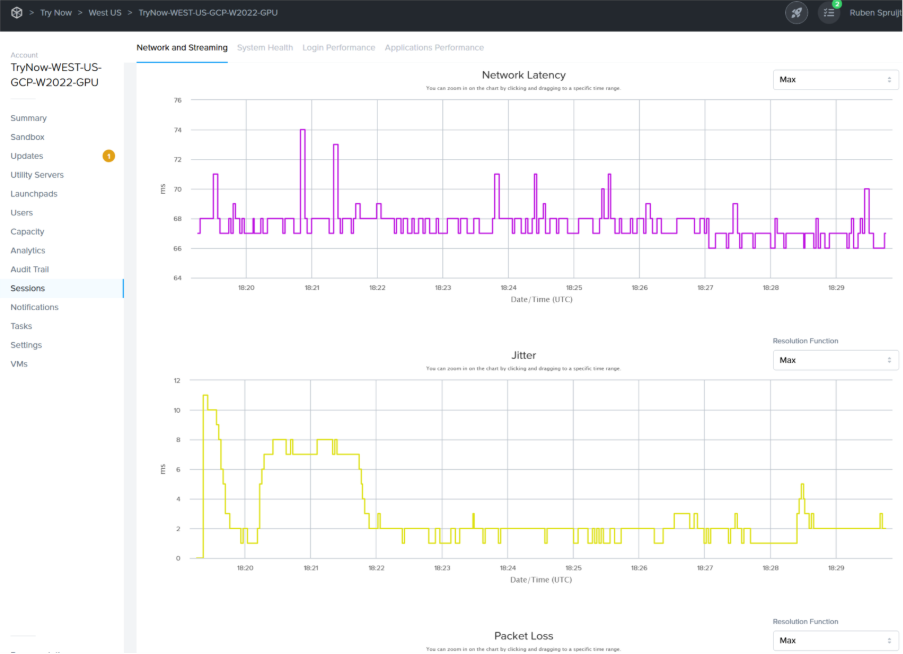
Frame Remoting Protocol (FRP) streaming performance
Overwatch uses FRP telemetry data and measures framerate (FPS), average and maximum compression, quantization levels (QP), estimated available and used bandwidth, network latency, packet loss, and more. This telemetry is essential for diagnosing and analyzing streaming quality in LAN and network-constrained environments, troubleshooting user experience issues, and ensuring performance matches user expectations.
User Login Performance
Few things frustrate users more than long login times. Overwatch breaks down each login phase — from GPO execution and Windows user profile load to shell initialization and events. It gives IT teams the information they need to analyze and optimize Windows login flows.

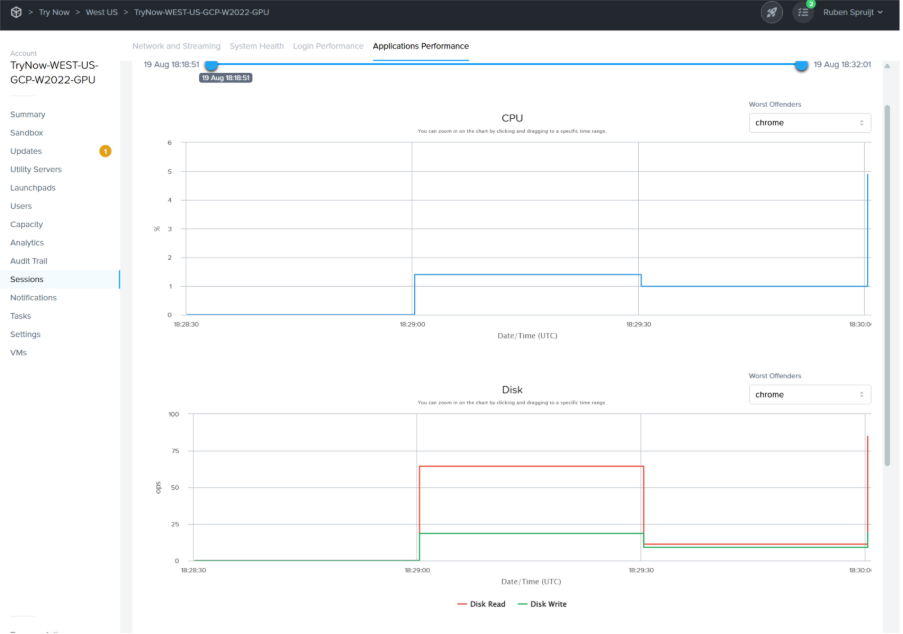
Application Performance
By monitoring per-process CPU and memory usage, disk reads/writes, and network consumption, Dizzion Overwatch reveals how applications behave in real-world use. This helps with right-sizing environments, detecting misbehaving apps, and understanding application behavior.