# Monitoring and Analytics
Tasks and Notifications, Analytics, Audit Trail, Session Shadowing, Overwatch observability and Analytics
# Tasks and Notifications
In this document, we'll review how to access and interpret tasks and notifications for your Frame tenant. With real-time updates on tasks displayed prominently in a dedicated widget, and a structured notification system tailored to your administrative level, you'll find overseeing your Frame entity to be very efficient.
We'll discuss the differences between tasks and notifications in more detail below.
## Tasks
Tasks are presented in both the widget and the entity Dashboard page views, each differentiated by distinctive color-coded states. For a convenient overview of these variations, refer to the table below, which serves as a handy guide for both views.
Status Icon Color
Details
Green
Successful, Succeeding, and Done task states will appear with a green icon.
Red
Failed and Failing task states will appear with a red icon.
Gray
Canceled and Canceling task states will appear with a gray icon.
Cycling Blue
In progress tasks will display with a cycling blue icon until the task is complete, canceled, or has failed.
### Tasks Widget
The Tasks Widget, conveniently located in the upper corner of your Frame Console and Dashboard views, offers a clear view of the tasks that you have personally initiated. We will first delve into the details of the Tasks Widget, followed by an exploration of the Tasks page, which can be accessed from your entity Dashboard.
Clicking on the widget's menu icon will display your personal list of tasks tied to any of the entities you have access to that you have initiated.
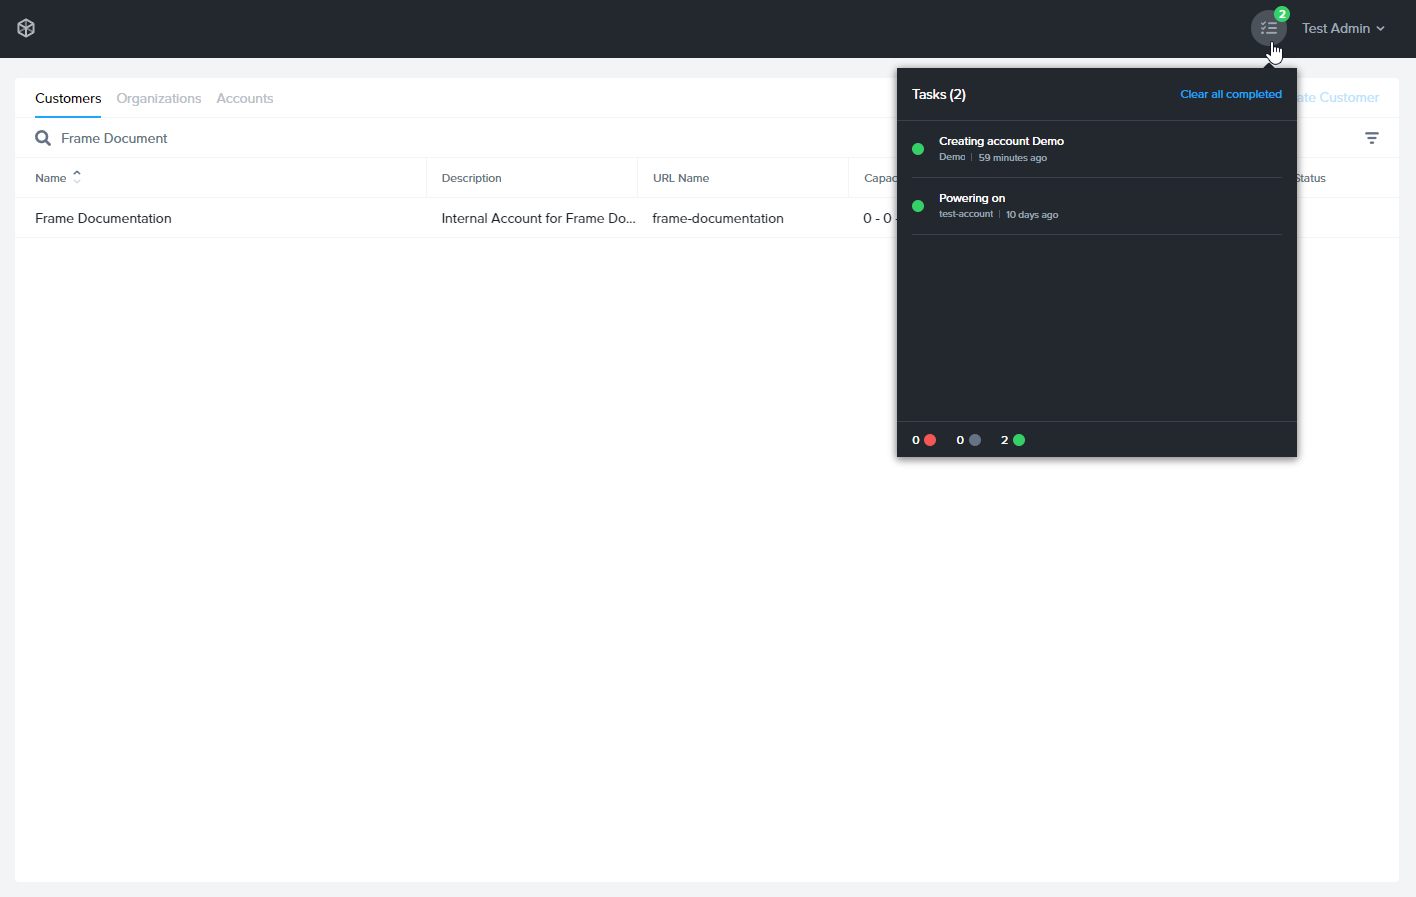
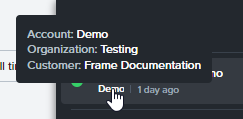
Every task is detailed in the widget, encompassing the task's title, its current status, the associated entity, and the time elapsed since the initiation of the task.
You can acknowledge a task simply by clicking the check icon that appears when hovering over a task in the widget, as shown below.
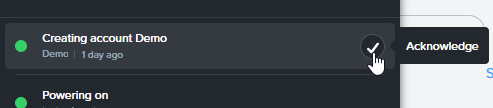
Acknowledging the task will remove it from your widget. If you need to reference it later, you can do so by going to the **Tasks** page in the entity Dashboard which we will discuss later in more detail.
You may also click the **Clear all completed** text in the upper right corner of the tasks widget if you would like to empty your task list.
Tasks cleared from the widget will still be accessible from the entity Dashboard.
### Tasks Page
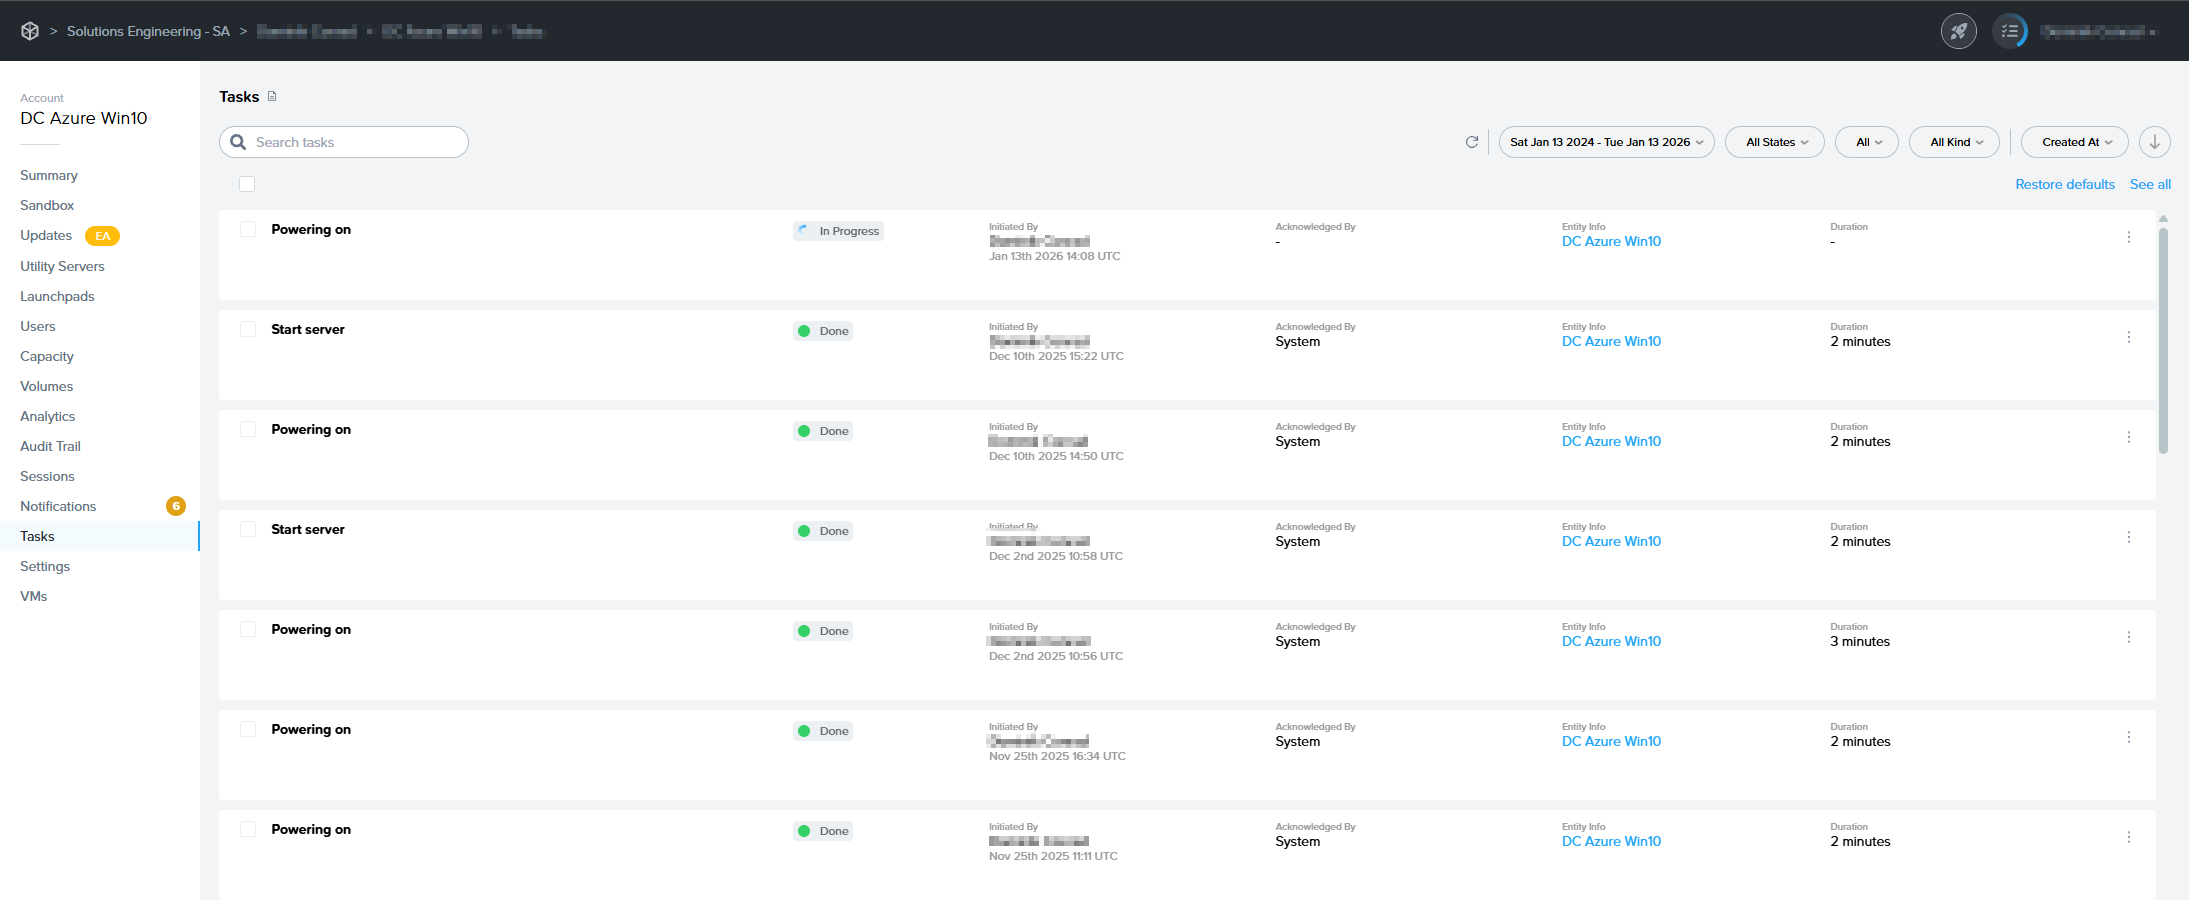
The "Tasks" page in the admin interface offers administrators a comprehensive and streamlined view of operational tasks within the system. From this interface, administrators can effortlessly track the progress and status of various tasks, such as powering on or off, and account creation. Administrators can search through their tasks using the search bar as well as fine-tune the display of tasks by employing the filtering options provided at the top of the page.
[](https://docs.difr.com/uploads/images/gallery/2026-01/image.png)
Clicking \*\*Restore defaults\*\* at the top of the page will reset all task filters to default.
Each task entry provides vital details at a glance, including the task title, the task status denoted by a color-coded icon, the initiator of the task with an initiation timestamp, who the task was acknowledged by, the associated entity, and the total duration of the task. Hovering over the **Entity Info** will provide additional details about the entity.
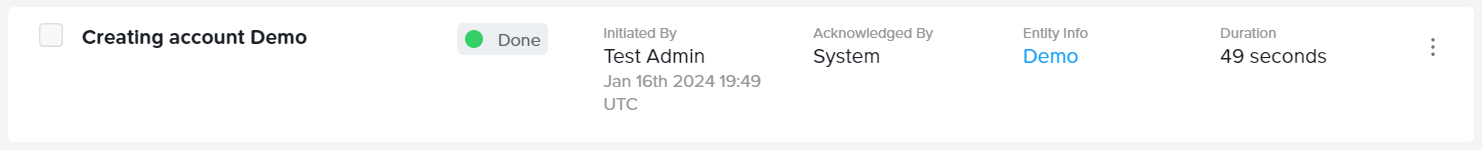
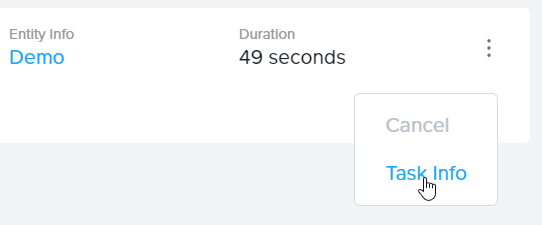
Clicking on the kebab menu to the right of the task provides administrators with the option to cancel an in-progress task or view the task's **Task Info** page.
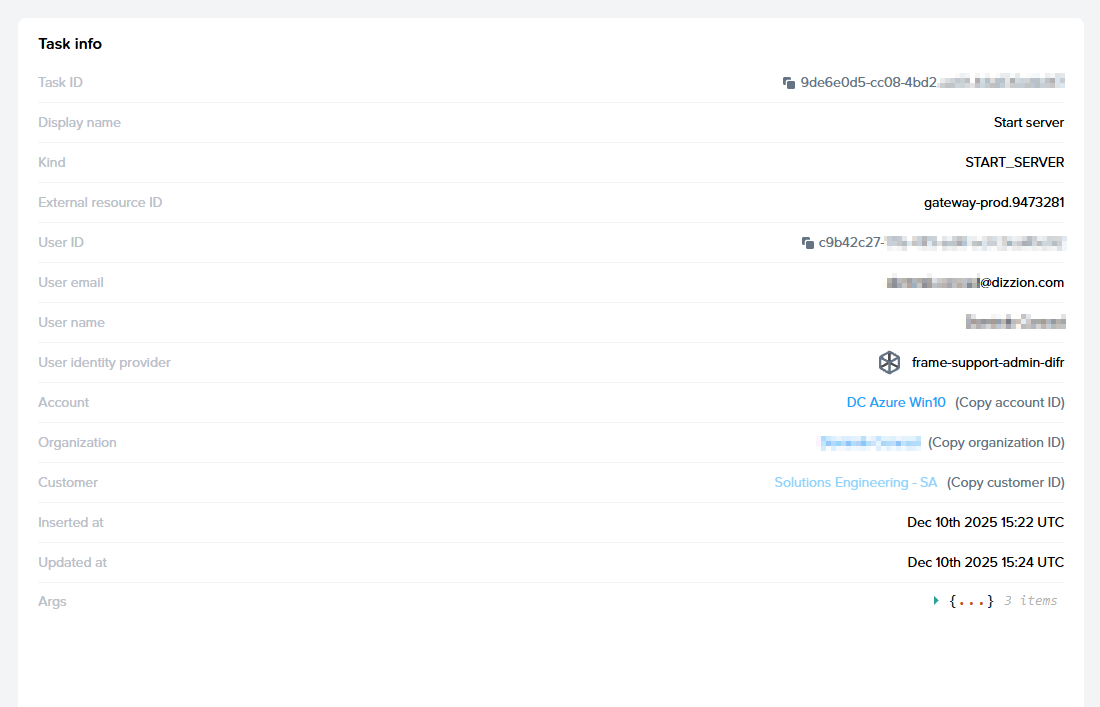
The **Task Info** page provides an in-depth look at the specific details of individual tasks within the admin interface. This detailed view is organized into two main sections: **Task Info** and **Task Progress.**
#### Task Info
[](https://docs.difr.com/uploads/images/gallery/2026-01/S2simage.png)
Info
Additional Details
Task ID
Unique identifier for the task within the platform. Can be used for troubleshooting
Display Name
Descriptive title of the task, e.g., "Creating account Demo"
Kind
Type of task being performed and how it is identified by Frame platform
User ID
Unique identifier of the user who initiated the task
User Email
Email address of the user associated with the task
User Name
Name of the user who initiated the task
User Identity Provider
Identity provider associated with the user initiating the task
Account
Account entity where the task occurred
Organization
Organization entity where the task occurred
Customer
Customer entity where the task occurred
Inserted at
Timestamp of when the task was initially logged in the system
Updated at
Timestamp of the last update made to the task
Args
Additional arguments associated with the task which can be provided to Dizzion support for troubleshooting. Click the arrow to expand for more information.
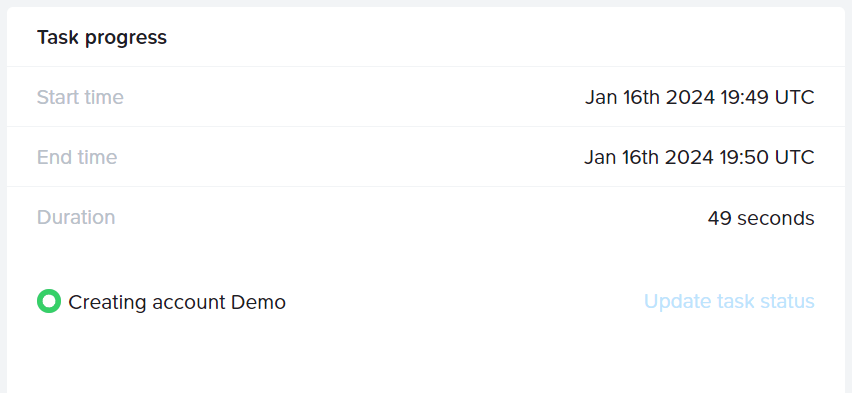
#### Task Progress
Info
Additional Details
Start Time
Timestamp of when the task was initiated
End Time
Timestamp of when the task ended
Duration
The total duration of time required to complete the task
## Notifications
Notifications serve as a crucial conduit of information for administrators, offering insights into a broad spectrum of operational aspects including platform management, billing details, cloud account statuses, networking updates, and many other pivotal areas. These alerts are exclusively available on the **Notifications page** within the entity Dashboard. We categorize notifications into three distinct severity levels, each of which are detailed in the table below:
Status
Details
Info
"Info" notifications are informational and typically refer to events that have little to no impact on your users.
Warning
"Warning" notifications are intended to inform the administrator of events that could potentially impact the functionality of their accounts and user experience.
Critical
"Critical" notifications are of the highest severity and describe events that have a direct impact on platform functionality and/or user experience.
### Notification Page
Notifications are displayed on the entity Dashboard page and are organized according to the hierarchical structure of their Frame tenant. For instance, when administrators access the Notifications page at the Customer entity level — the topmost layer of a Frame tenant — they gain visibility into notifications pertaining to all subordinate Organizations and Accounts. Similarly, notifications for every Account nested within a particular Organization will be visible on the Organization Dashboard. Conversely, visiting the Notifications page on an Account Dashboard will exclusively show notifications relevant to that specific account. Administrators can search through their notifications using the search bar as well as fine-tune the display of notifications by employing the filtering options provided at the top of the page.
[](https://docs.difr.com/uploads/images/gallery/2026-01/wZPimage.png)
Clicking \*\*Restore defaults\*\* at the top of the page will reset all task filters to default.
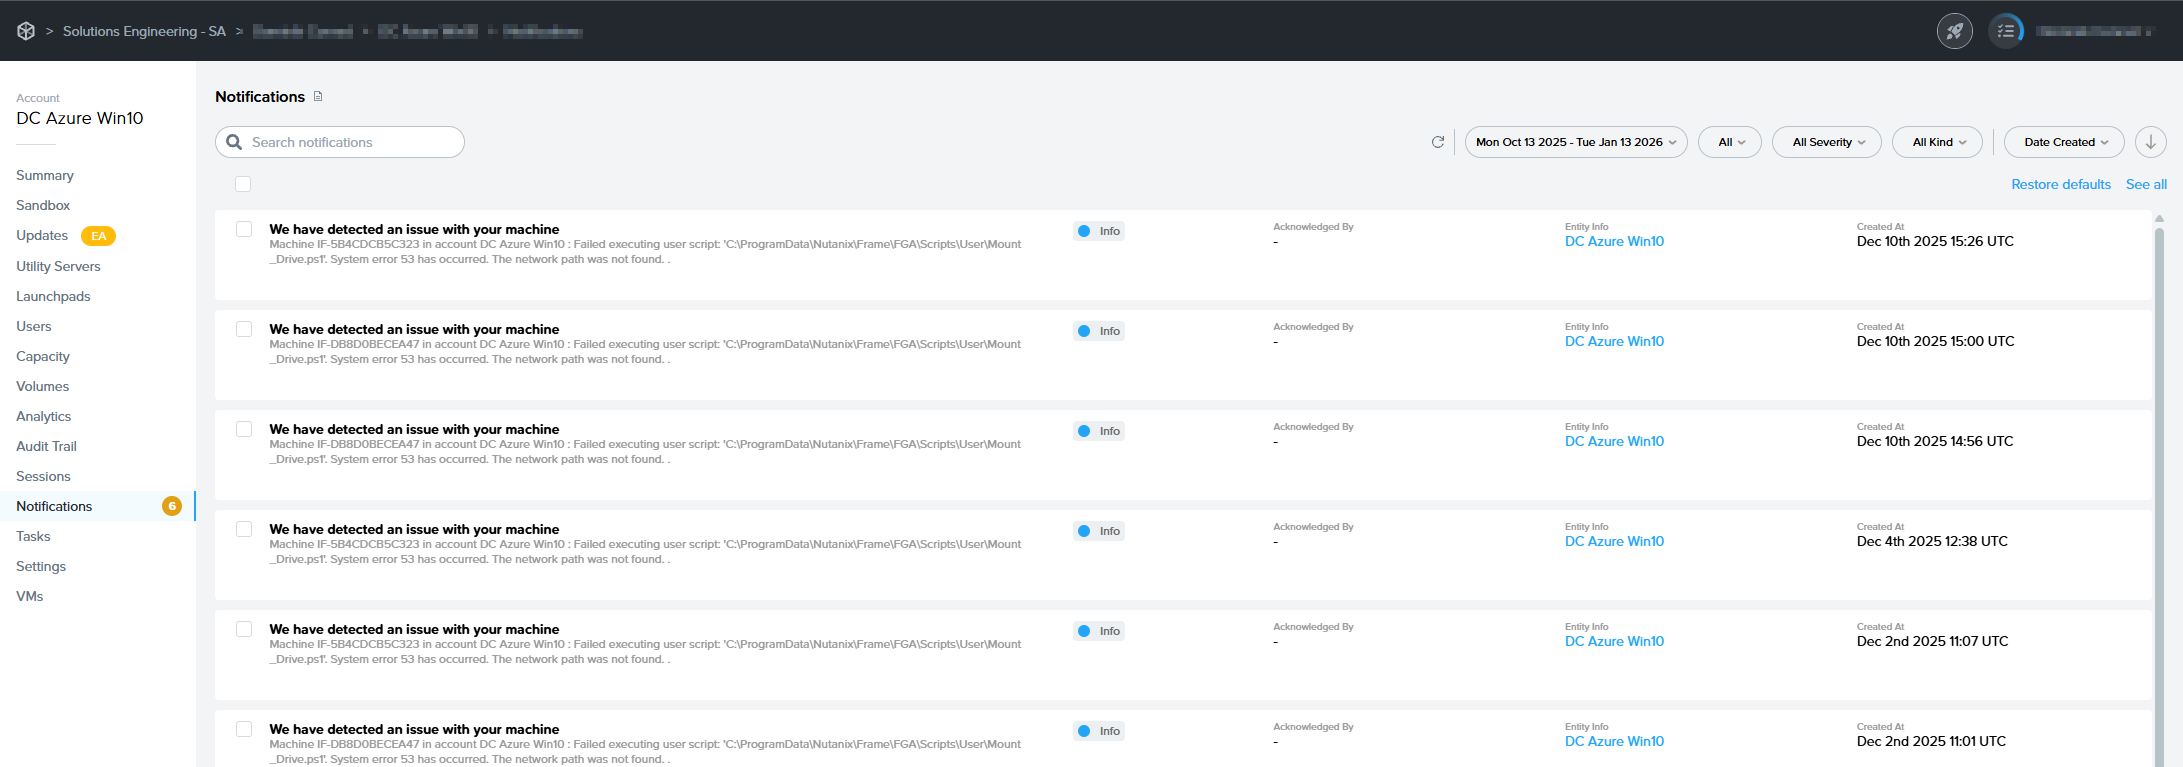
Each notifcation entry provides important details at a glance, including the notification kind, a summary of the event, the severity of the event, the associated entity, and a timestamp of the when the notification was created.
[](https://docs.difr.com/uploads/images/gallery/2026-01/X37image.png)
Lastly, administrators can clear the notification entries from the page by clicking the checkbox next to the notification and selecting **Mark as Acknowledged.**
# Analytics
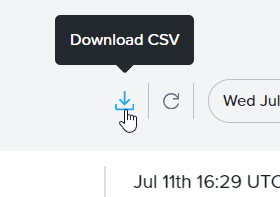
Frame provides a variety of reports to see exact usage and analytics about your tenant. Navigate to the “Analytics” panel in your Dashboard to see detailed information about your users' sessions, usage, disk usage, and elasticity at the account level. Each of these reports can be downloaded using the **Download CSV** button in the upper right corner of the panel.
Customer Administrators can see the analytics data for all organizations and accounts associated with the tenant by navigating to the Customer or Organization Dashboard from the initial Admin Console view and clicking Analytics.
## Sessions
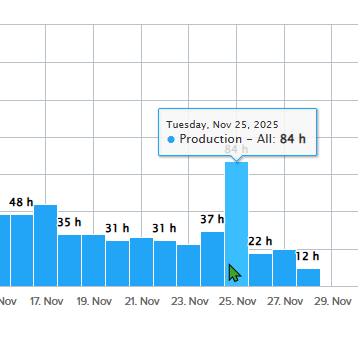
The “Sessions” tab is the first page displayed on the Analytics page of your Dashboard. This page shows a plot of the number of sessions per hour, day, or month during a given time interval. Use the drop down menus on this tab to display the information by frequency, system, and time period. This example shows the number of production sessions launched within a month.
[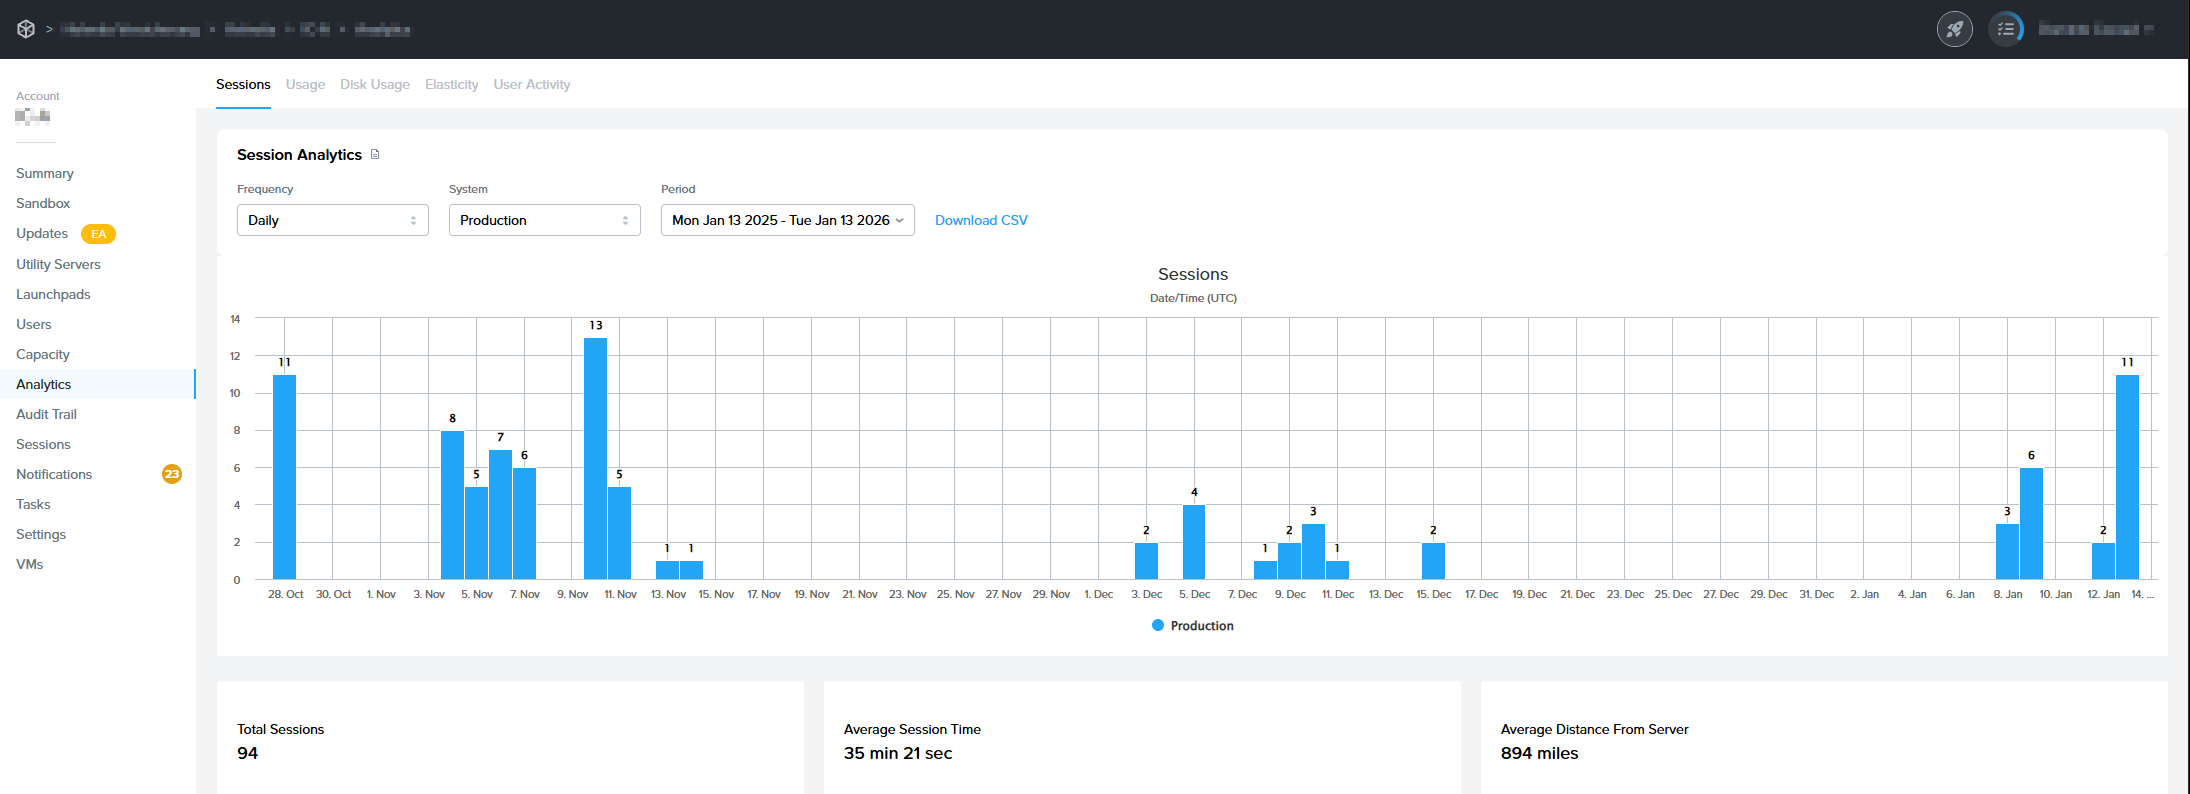](https://docs.difr.com/uploads/images/gallery/2026-01/AaCimage.png)
*Analytics - Sessions*You can also see the total sessions, average session time, and average distance from the datacenter displayed below the graph.
More detailed information is displayed when hovering over a bar on the graph.
[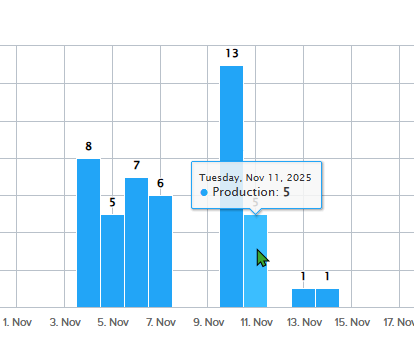](https://docs.difr.com/uploads/images/gallery/2026-01/BYsimage.png)
In this example, we can see there were 3,539 total production instances on February 10th, 2022.
## Usage
The “Usage” tab is the next tab over on the Analytics page. “Usage” provides detailed information about the hourly usage consumed per specified frequency, system, pool, and time interval.
[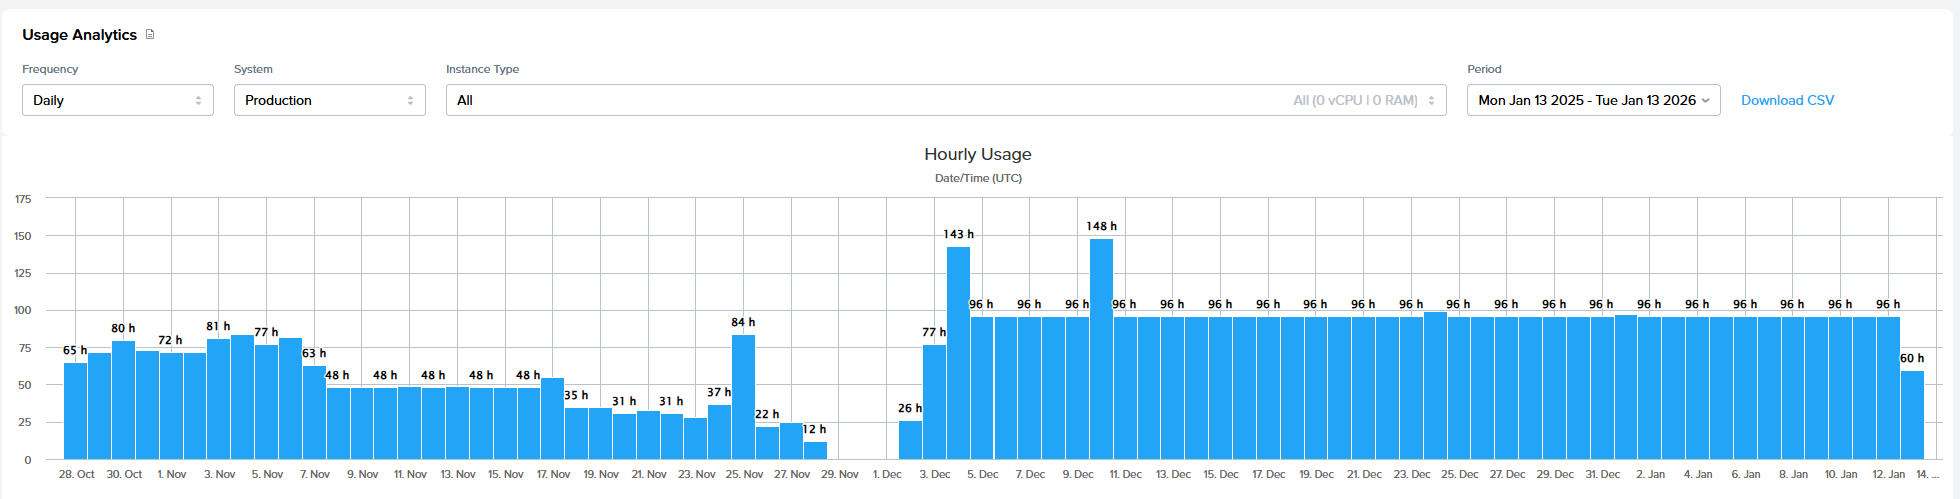](https://docs.difr.com/uploads/images/gallery/2026-01/Ombimage.png)
The hourly usage is broken up by system type, with a key for each system type displayed below. Toggle which system types are displayed on the graph by clicking on them or changing the “Pool” from the drop down menu. In the example below, we have disabled the production Air 16GB system type.
[](https://docs.difr.com/uploads/images/gallery/2026-01/nymimage.png)
*Analytics - Usage - Mouseover*The total hours used will always be displayed on the bottom left side of the graph on this page.
## Disk Usage
The “Disk Usage” tab displays the amount of disk volume usage (in GB) within a specific period of time. You can adjust the frequency (hourly, daily, or monthly) using the drop down menu above the graph.
[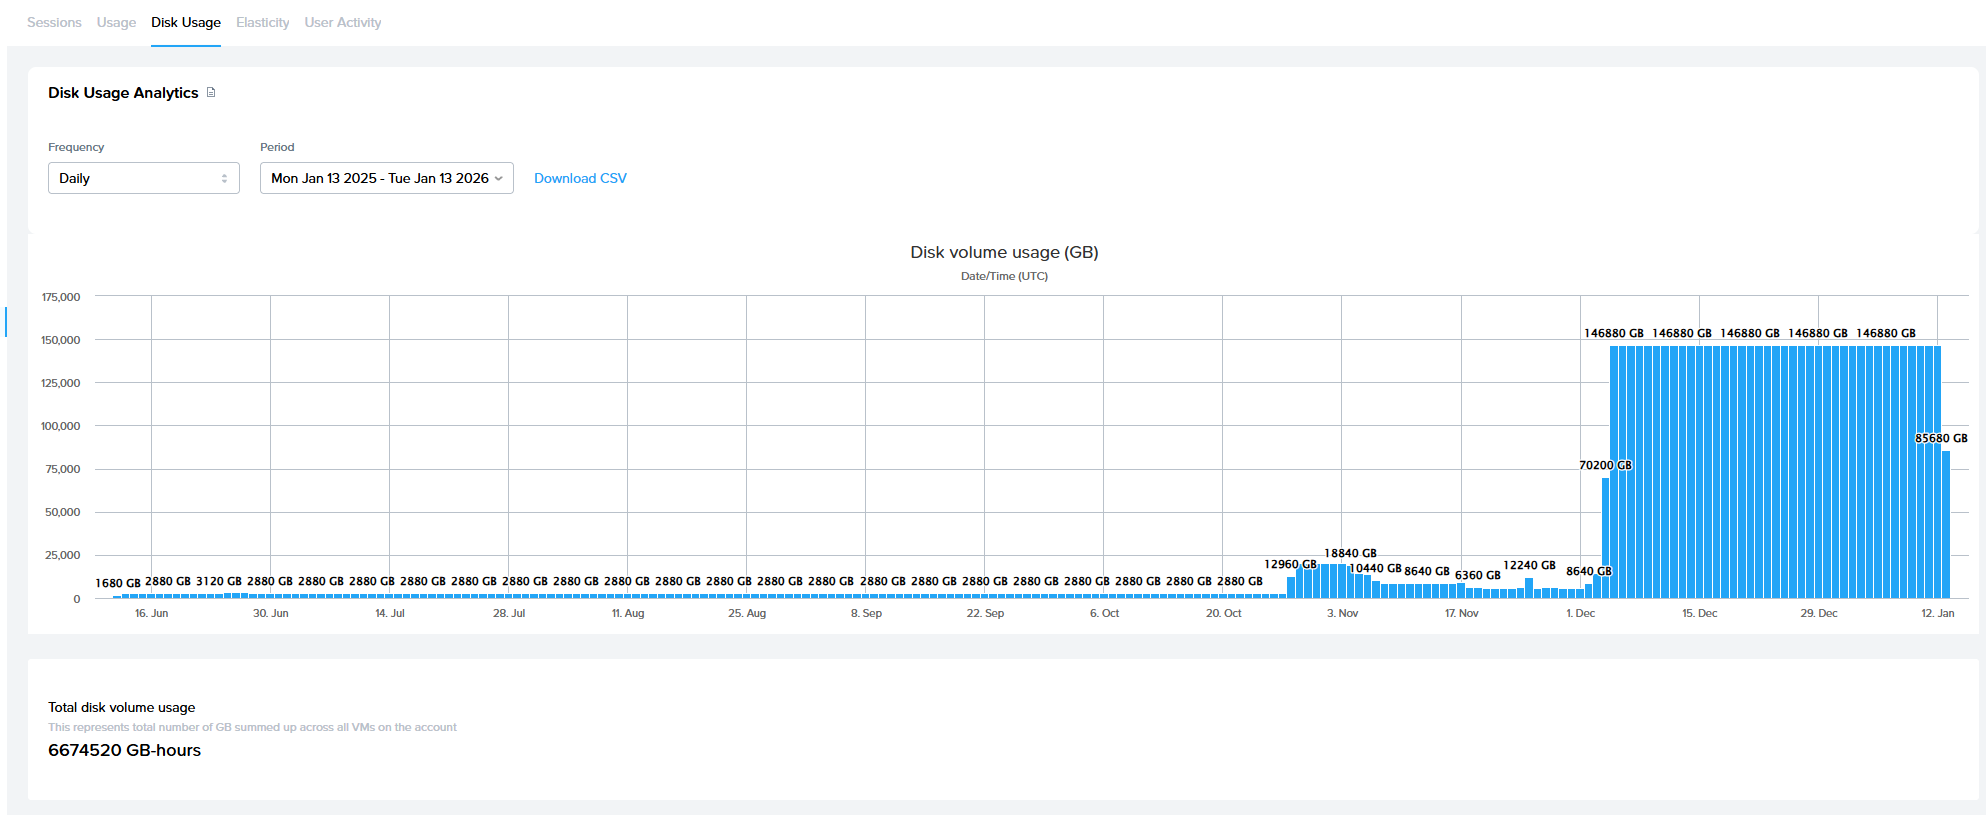](https://docs.difr.com/uploads/images/gallery/2026-01/bjximage.png)
More detailed information is displayed when hovering over a bar on the graph.
[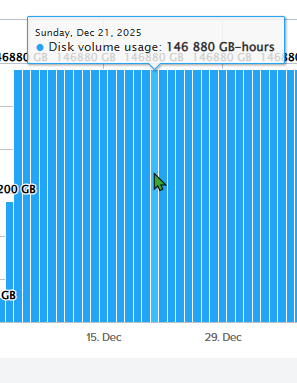](https://docs.difr.com/uploads/images/gallery/2026-01/cC4image.png)
The total disk volume usage (in GB hours) will always be displayed in the bottom left corner below the graph.
## User Activity
The "User Activity" tab lists the users who have logged into Frame Console by their first and last name, identity provider, identity provider-provided email address, and the date/time the user was successfully logged into Frame. Use the dropdown menus on this tab to specify the date range of the User Activity report. The User Activity report also summarizes the total number of successful user logins and unique users (identity provider and email address) within the specified date range.
## Elasticity
The Elasticity tab provides additional detail for evaluating the performance of your capacity settings (min, max, and buffer). The most important part of this chart lets you compare the active sessions (represents users that are connecting) to active instances (the number of systems that are powered on and are consuming usage hours). For example, if you find that your active instances are always much higher than your active sessions, then you should consider lowering your “min” and “buffer” settings. Additionally, you can use this graph to ensure your Default Capacity max is not too high relative to the peak active sessions.
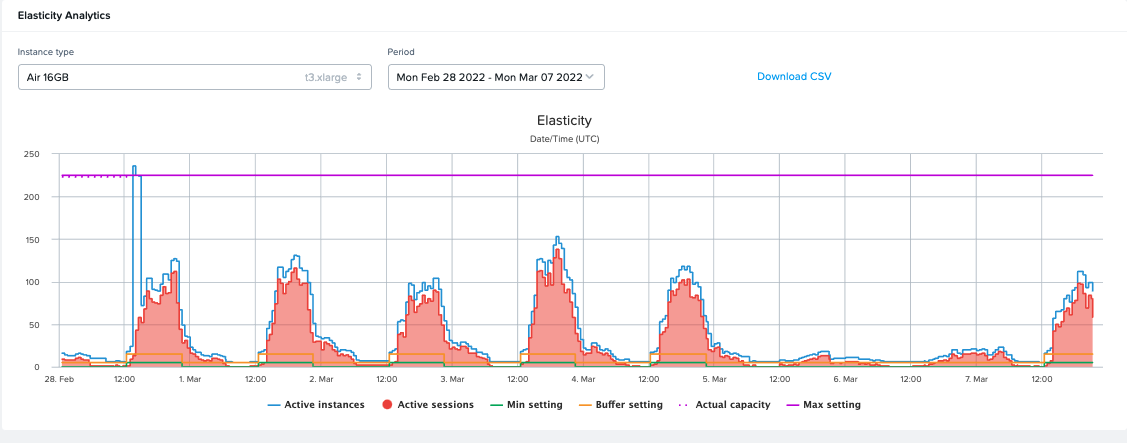
*Analytics - Elasticity*More detailed information is displayed when hovering over a point on the graph.
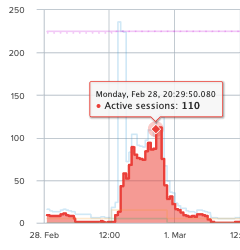
Individual measures can be enabled and disabled by clicking the text descriptor for the measures.
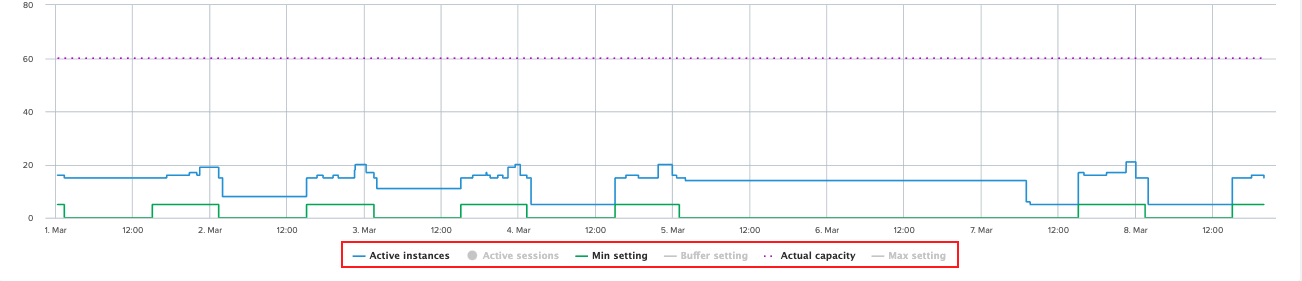
The measures are defined as:
- **Active Instances**: Active Instances are instances which are powered on.
- **Active Sessions**: An Active Session is an active instance with a connected user.
- **Min setting**: The minimum number of instances powered on at a given time that can be accessed by users immediately.
- **Buffer setting**: Additional powered-on instances that are ready for a user within seconds. Set this to a number of users you expect will connect within a 2-minute window of time (the time it takes to boot an instance).
- **Actual capacity**: The total number of instances, active or otherwise, that could be provisioned.
- **Max setting**: The desired number of instances (concurrent users) to be provisioned for the pool. The administrator should determine this number based on peak session concurrency since this is a hard limit.
### CSV Download
When downloading the Elasticity report values as a CSV file, Frame Console adds two additional variables to the CSV file:
- **Pool Kind**: `production` to indicate that the values are for a production pool and a blank value to indicate that the values are for a test pool.
- **Time**: Specifies the date/time (in UTC) for the change in value for one or more measures.
## Session Reports
The session reports feature allows administrators to download and view session activity logs as .CSV files for more detailed user tracking and session troubleshooting. This section outlines how to enable and interpret session reports.
### Enable Session Reports
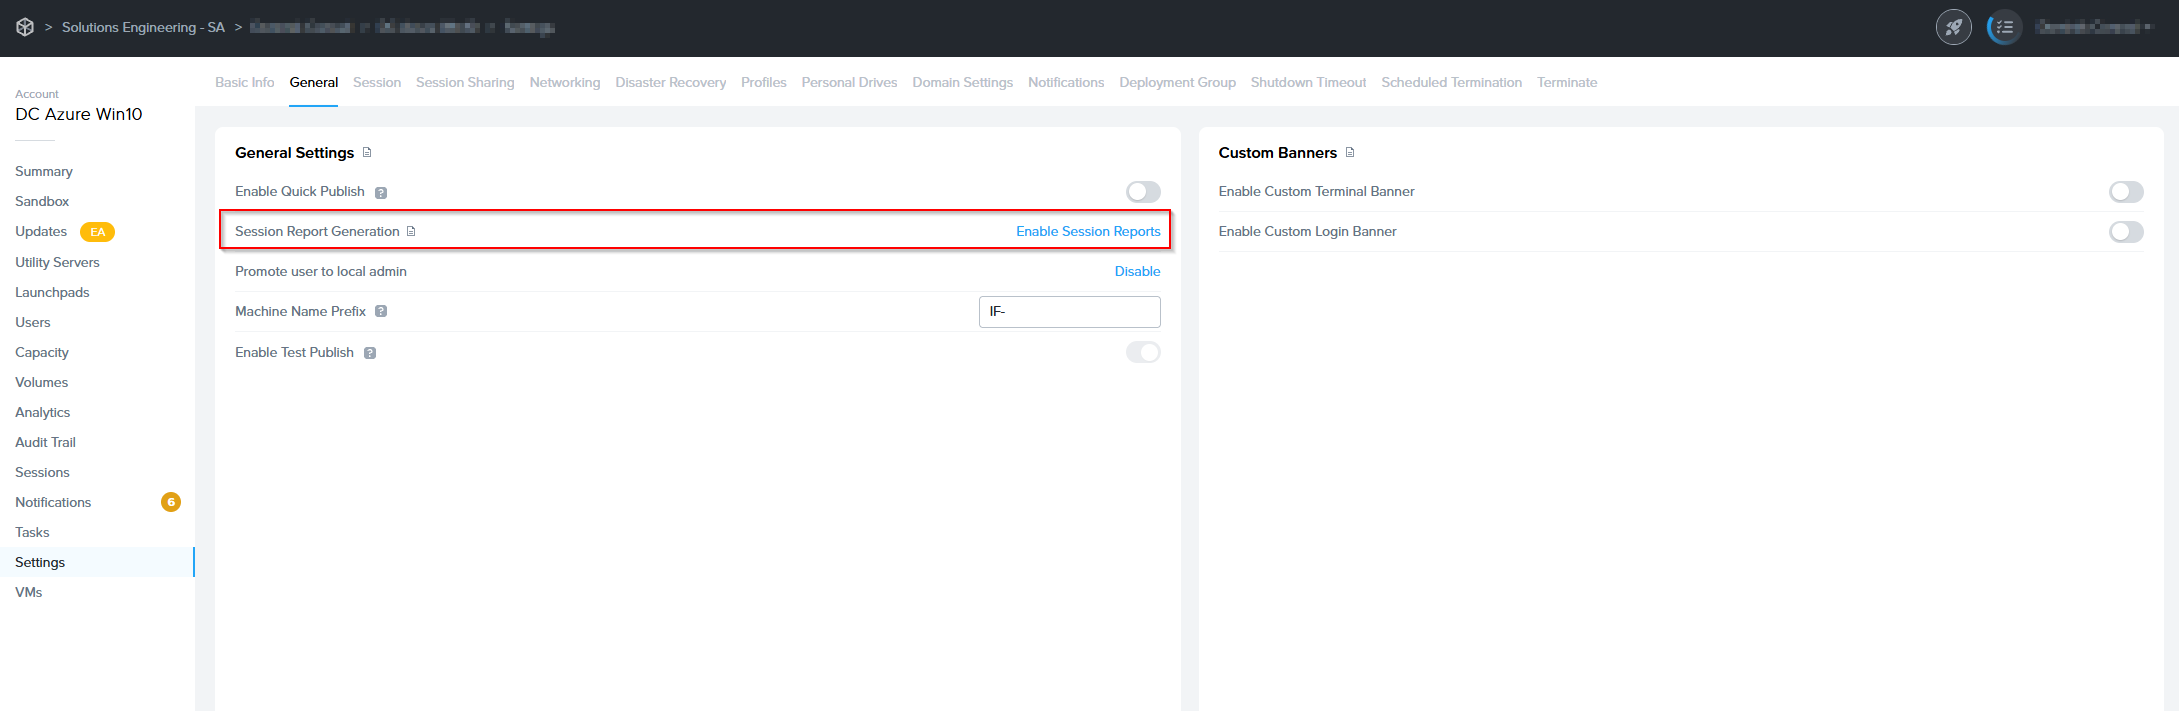
To enable session reports, navigate to the Settings tab of the Nutanix Console and click the “session reports generation” option.
Once enabled, session report generation cannot be disabled.
[](https://docs.difr.com/uploads/images/gallery/2026-01/QDUimage.png)
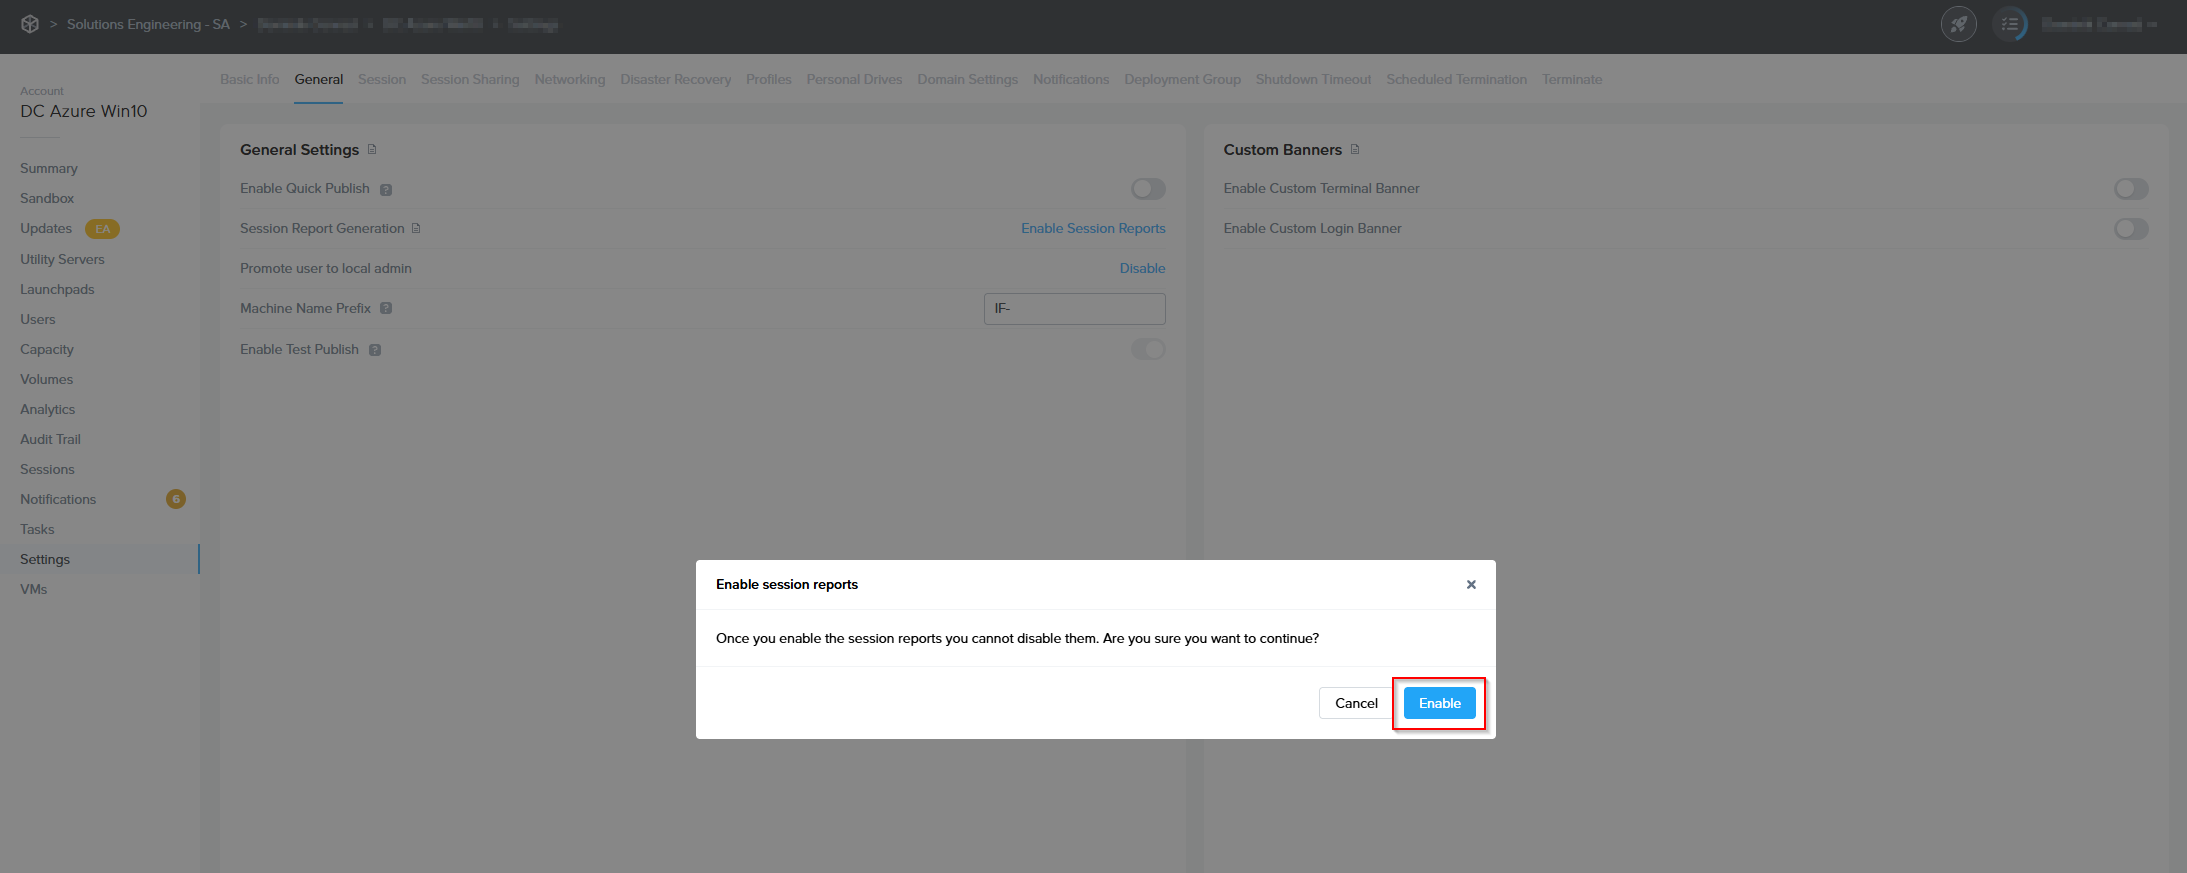
A prompt will open formally notifying you that these changes cannot be reversed. Click Accept.
[](https://docs.difr.com/uploads/images/gallery/2026-01/umVimage.png)
Navigate to the Analytics tab of the Nutanix Console and select the session reports tab.
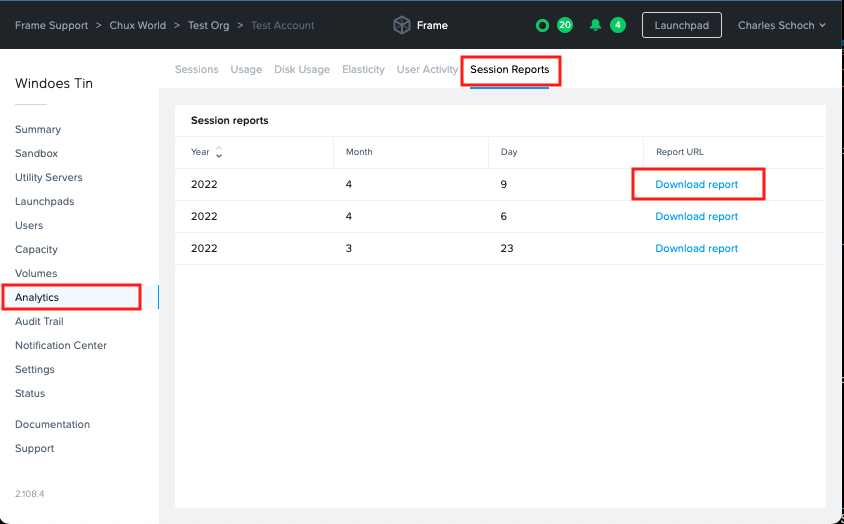
In order to download a specific report, simply click the corresponding “Download report” link and save the file to your local computer.
Once enabled, session reports take approximately 24 hours to be made available for download from the Frame Dashboard.
## Session Report Definition
The session report consist of a .CSV file which can be imported into the application of your choice for compiling into an itemized list with log activity of all sessions from the reports date range. This information consists of:
Name
Description
Username
The user ID associated with the session.
Name
The user's name on record.
Email
The email address associated with the user of the session.
Geo\_Distance
An estimate of the geographic distance between the user's location and the datacenter accessed, measured in miles.
City
The name of the city the user accessed their session from, as indicated by IP address.
Started\_At
UTC Time and date the session was started.
Time\_To\_Start
Elapsed time from an instance being requested to the session beginning, measured in seconds.
Session\_Duration
Duration of the session, measured in seconds.
State
Whether the session is open or closed, at time of report generation.
Remote\_IP
The IP address utilized by the session user.
System\_Type
The type of instance utilized for the session.
Session\_Type
The type of instance used during the session. IE: Sandbox, Utility Server, Production Instance, Persistent Desktop.
User\_Data
Lists any custom data passed to the user's session via a userData object property.
Account\_ID
The Frame Vendor ID.
Account\_Name
Name of the Frame account accessed.
API\_Account\_ID
Not user serviceable at this time.
Region
The region of the cloud account.
Country
The country of the cloud account.
Session\_ID
The session ID.
Storage\_Used
Lists any attached personal cloud storage such as Google Drive or Dropbox.
# Audit Trail and Sessions
The **Audit Trail** and **Sessions** pages are integral components of your entity Dashboard, designed for comprehensive monitoring of user actions and session dynamics. The Audit Trail feature offers a meticulously maintained log that enables administrators to trace and sift through the activities of administrators of all access levels, ensuring transparency and accountability across all tiers of the Frame platform's hierarchy.
Simultaneously, the Sessions page which features Frame's **Sessions**, accessible from the same Dashboard, delivers granular insights into the live session activities pertinent to the specific Organization or Account in focus. This documentation will navigate you through the processes of accessing and utilizing both the Audit Trail and Sessions pages to their full potential.
## Audit Trail
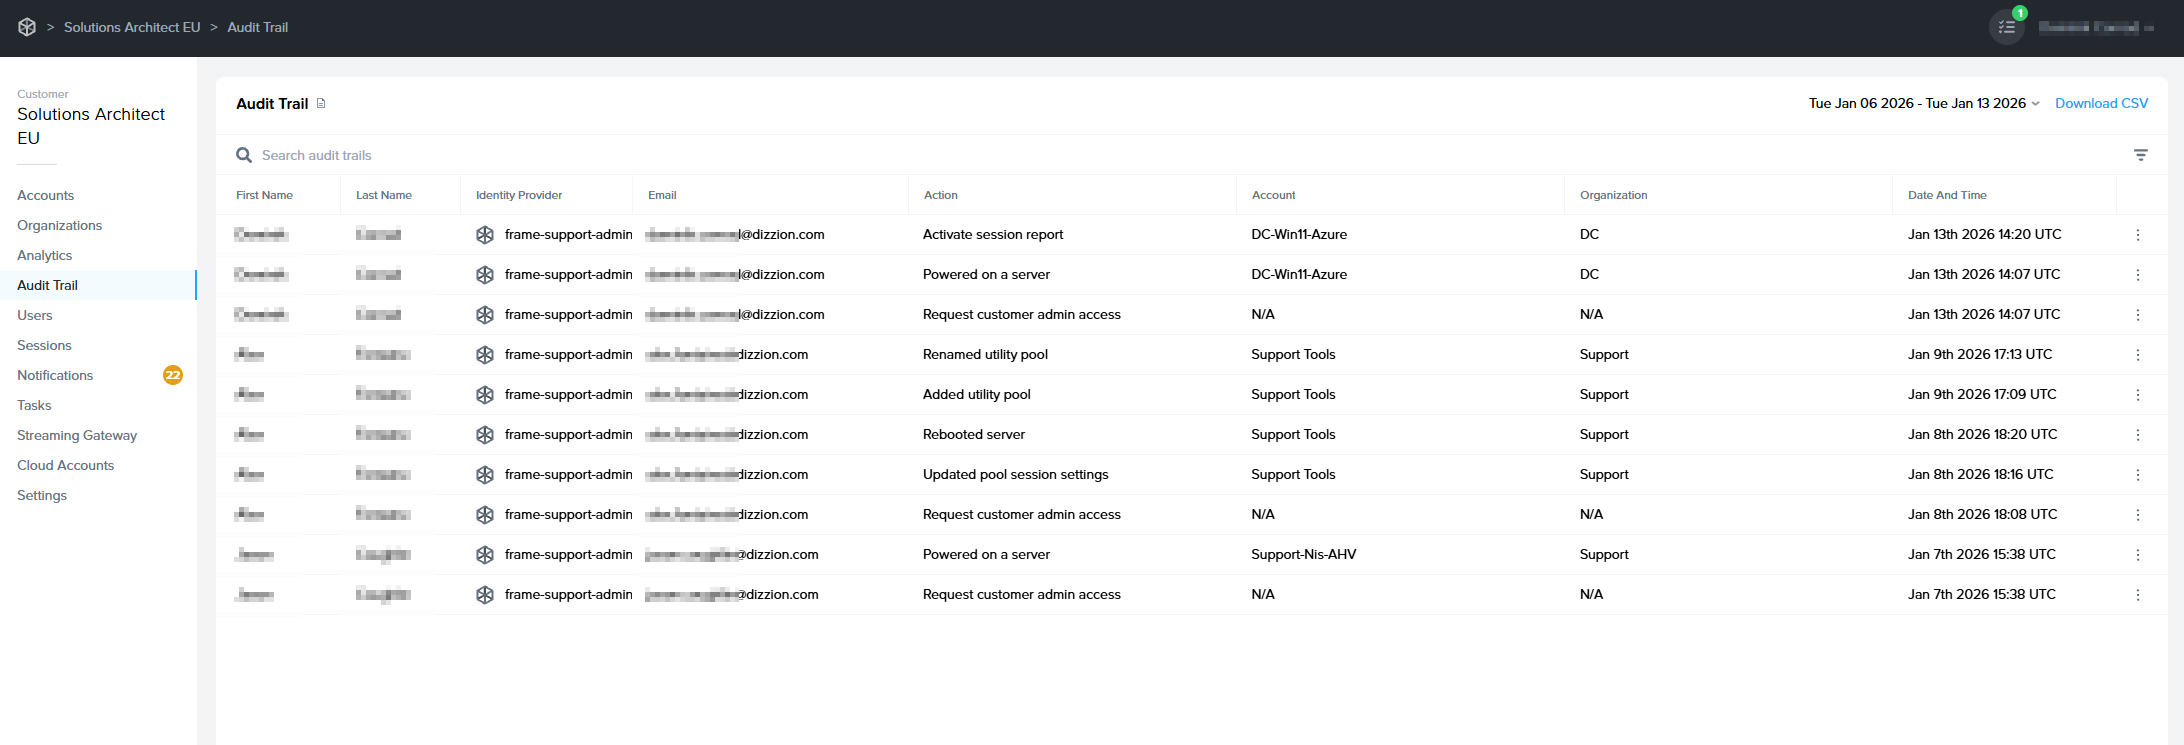
The Audit Trail page is designed to provide relevant information at each hierarchical layer of the Frame Tenant. When accessed from an Account Dashboard, it will present access reports exclusively for that Account. Conversely, if you access it through an Organization entity, it will encompass audit logs for all associated subordinate accounts.
In the example below, we are accessing the Audit Trail page of an Organization, which is why we're able to view administrator activity across multiple accounts under that Organizational entity.
[](https://docs.difr.com/uploads/images/gallery/2026-01/xosimage.png)
Administrators can search audit logs by first name, last name, and email address. Click the column titles to adjust the display order as desired.
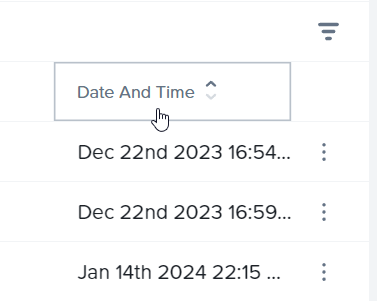
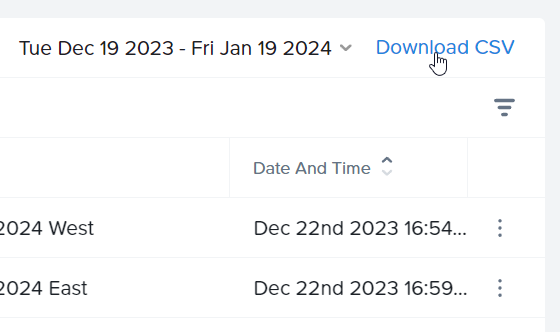
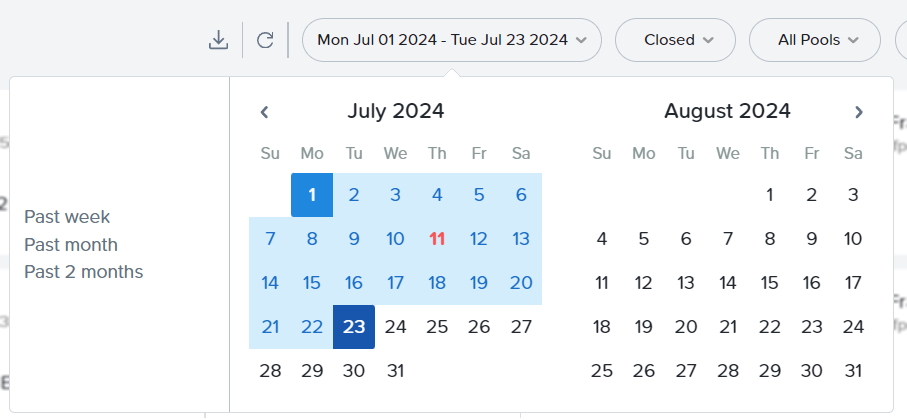
*Audit Trail - Sort by Date/Time*If you would like to search for audit events within a certain time frame, click on the date range in the upper right corner of the section. Set your desired time frame by clicking on the starting and ending dates in the calendar view.
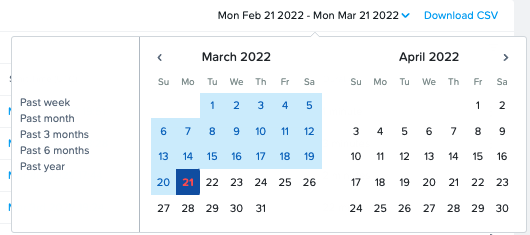
Using the filter icon in the top right corner, you can filter your results by specific account action.

Lastly, you can download the details of your Audit Trail in CSV format by clicking the blue **Download CSV** link in the upper right corner. The CSV will provide all Audit Trail details for the time frame specified to the left of the download link.
## Sessions
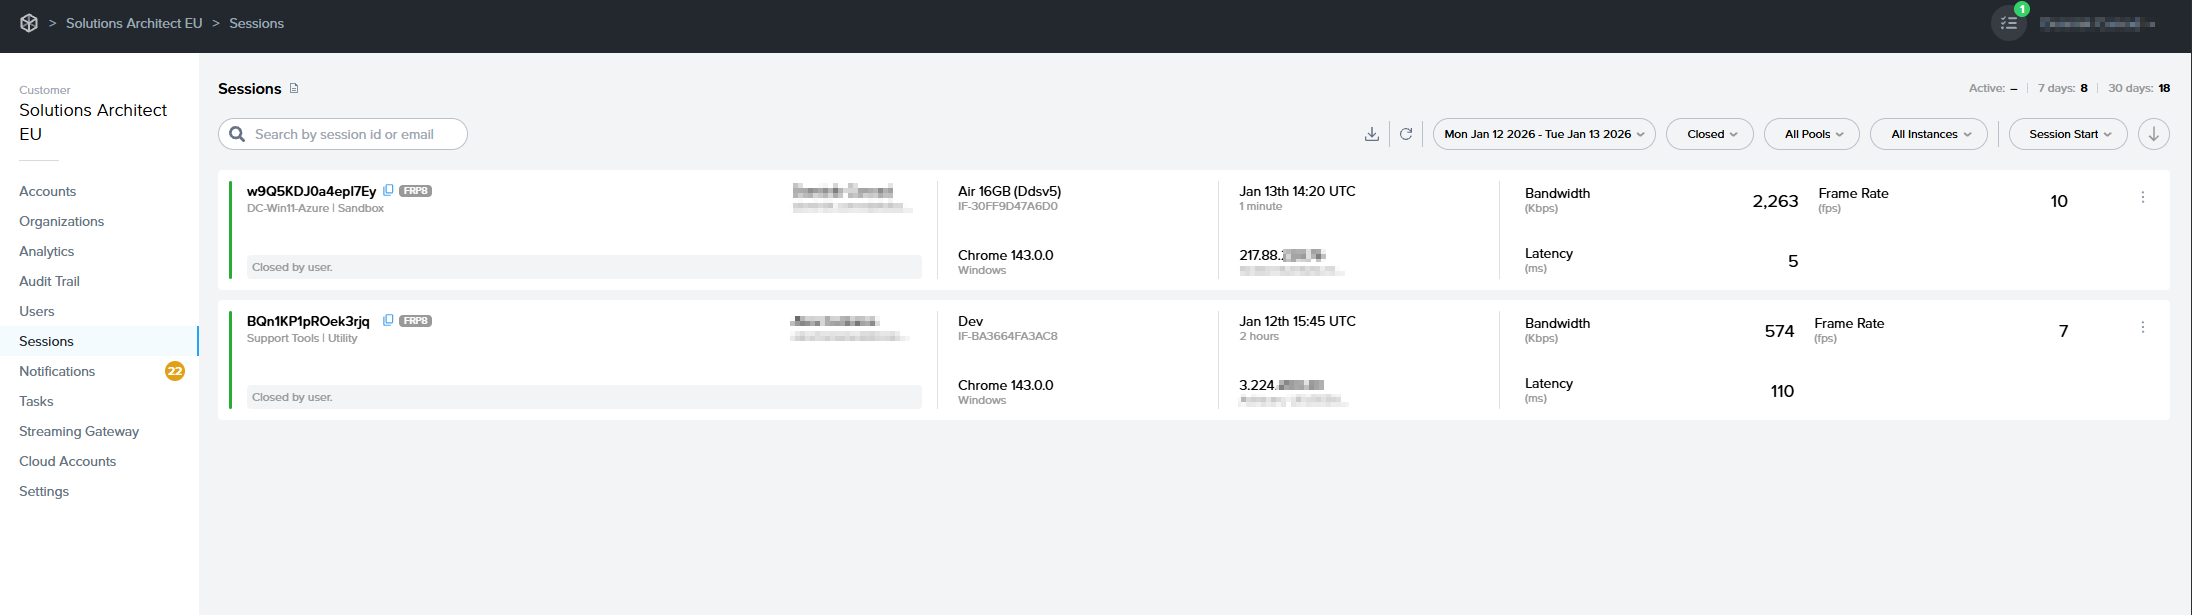
The **Sessions** page provides a comprehensive overview of user sessions in a card-style format. Each session card includes a unique Session ID, the specific Account and user involved, and the instance type used during the session. Detailed metrics such as bandwidth usage, frame rate, and latency offer insights into the performance and quality of each session.
Accessible from the Customer, Organization, and Account-level Dashboards, the **Sessions** page also features search functionality to quickly locate specific sessions. Additionally, you can download session data as a CSV file for further analysis. This page is a pivotal resource for administrators to monitor and evaluate user engagement and system performance on the Frame platform.
[](https://docs.difr.com/uploads/images/gallery/2026-01/08pimage.png)
### Session Card Information
Each card provides comprehensive information about the session. As you can see below, the card is split up into 4 different sections. Just like the Audit Trail page, you can also narrow your Session page information down by selecting a date range in the upper right corner.
[](https://docs.difr.com/uploads/images/gallery/2026-01/6N1image.png)

**Info**
**Description**
**Status Indicator**
The color of the bar shown in the far left side of the card indicates the session status. More details about session status can be found below.
**Session ID**
This unique identifier for the session is important when discussing a user session issue with Frame Support.
**Account Details**
Indicates if the session is Persistent, the name of the account, and the name of the Launchpad the session is tied to.
**User**
First name and last name of the user in session, as provided by a [third-party identity provider integration](https://docs.difr.com/books/platform-administrators-guide/page/identity-and-access) or [Basic Authentication](https://docs.difr.com/books/platform-administrators-guide/page/basic-authentication).
**Email**
Email address of the user accessing the session.
**Status Description**
The gray box at the bottom of the card describes specifics about the status of the session. In this example, this closed session was "closed by user."

**Info**
**Description**
**Instance Type**
Name of the instance type for this workload VM. Instance type names are specific to the underlying infrastructure. In the case of AHV, the instance type name will be the name you defined under the [AHV Cloud Account](https://docs.difr.com/books/platform-administrators-guide/page/cloud-accounts).
**VM Name**
Name of the workload VM.
**Browser**
The browser and browser version number being used to access the session.
**OS**
The type of operating system on the endpoint device being used to access the session.

**Info**
**Description**
**Start Time**
The time (UTC or local time of the administrator's endpoint) when the user connected to a virtual machine using Frame Remoting Protocol.
**Session Duration**
The time span from the session's start (when the user connected to a virtual machine) to its end (when the user logged out of the operating system).
**IP Address**
The IP address from which the session was accessed.

**Info**
**Description**
**Bandwidth**
Average bandwidth consumed during the session. Min, average, and max values can be viewed by hovering over the bandwidth value. **For sessions with multiple displays, bandwidth metrics are cumulative across displays.**
**Latency**
Average latency measured during the session. Min, average, and max values are displayed upon hovering over the latency value.
**Frame Rate**
Average frame rate during the session. Min, average, and max values can be revealed by hovering over the frame rate value.
Hovering over the values within each card will display additional information.
Additionally, you can identify the status of the session at a glance by the color of the bar on the far left side of each card.
Color and Status
Description
Active
The session is currently in use. The status description will likely show "Active Session."
Closed
Indicates a closed session. Admins may see "Closed by user" or "Idle timeout has expired" in the status description box.
Failed
This status indicates a failed session. The gray status description box will show the word "FAILED" in red along with a failed reason, if available.
Suspended
Suspended sessions will still be shown as active, however, they are in a suspended state. You can see suspended sessions by clicking the "Suspended" option from the session status dropdown menu at the top of the page.
You can use the search bar under the section header by entering details such as a user's email, name, or Session ID. Select the first dropdown menu on the right side of the page to adjust the date range.
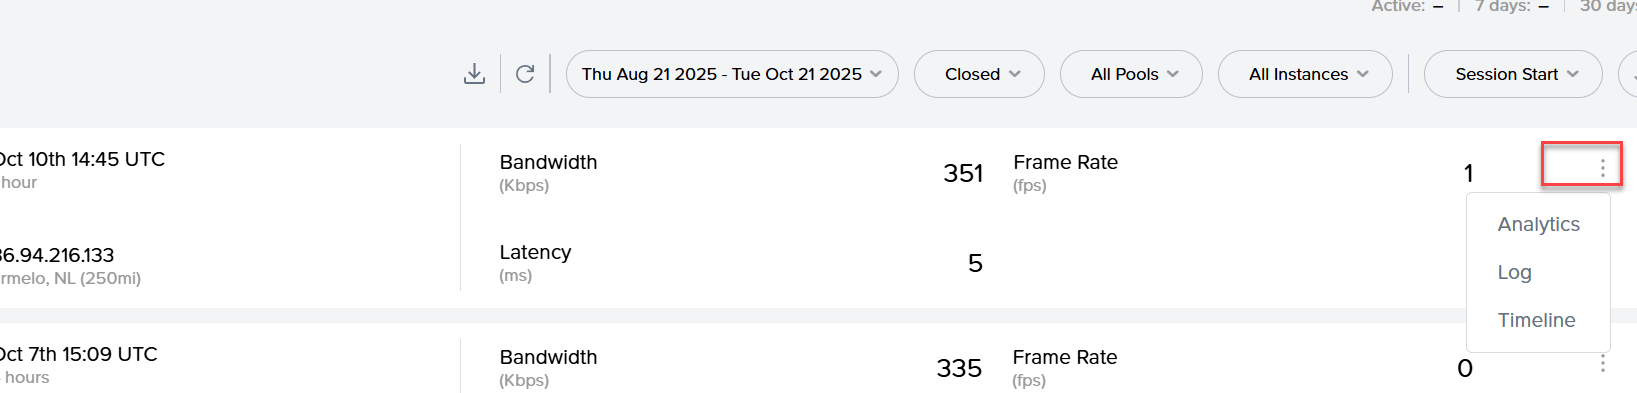
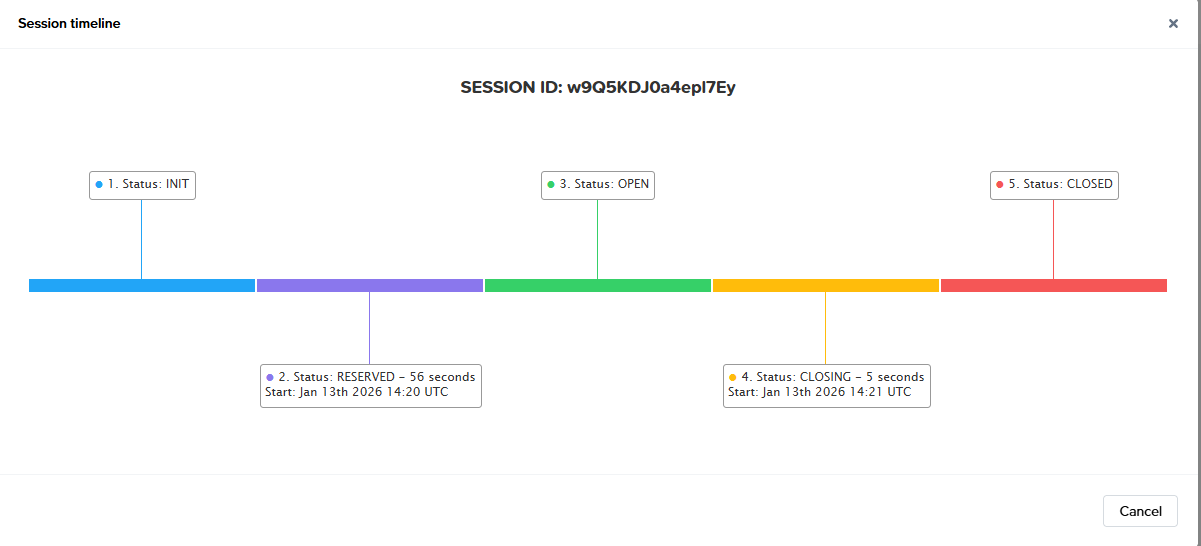
### Session TimeLine
Click on the kebab menu listed next to any session and select **Timeline** to display a timeline view of session events.
[](https://docs.difr.com/uploads/images/gallery/2025-10/Ubeimage.png)
[](https://docs.difr.com/uploads/images/gallery/2026-01/Jhaimage.png)
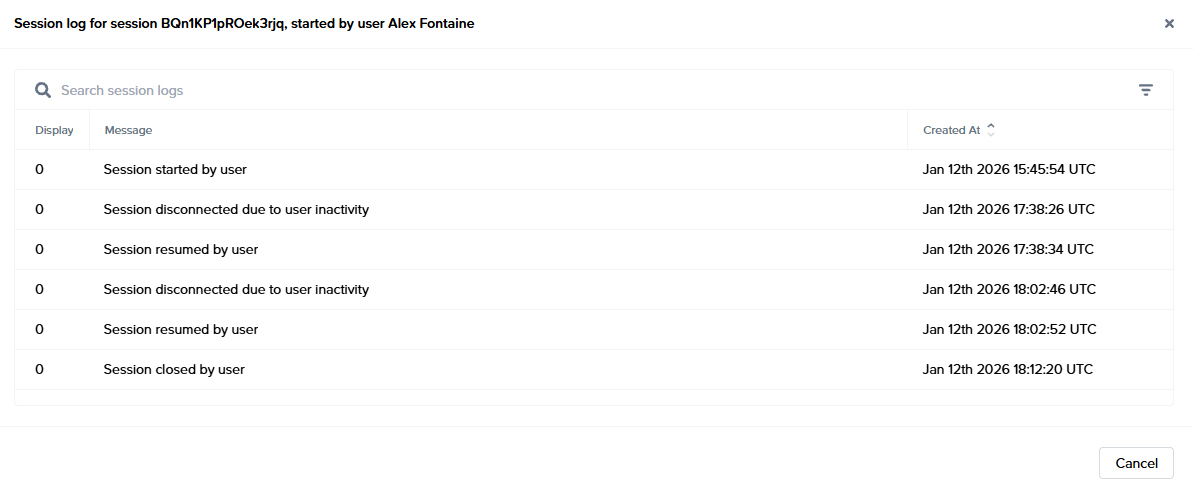
### Session Log
Additionally, you can access the Logs for a session directly from the interface by selecting **Log** from the kebab menu of the desired session.
[](https://docs.difr.com/uploads/images/gallery/2026-01/Z3Limage.png)
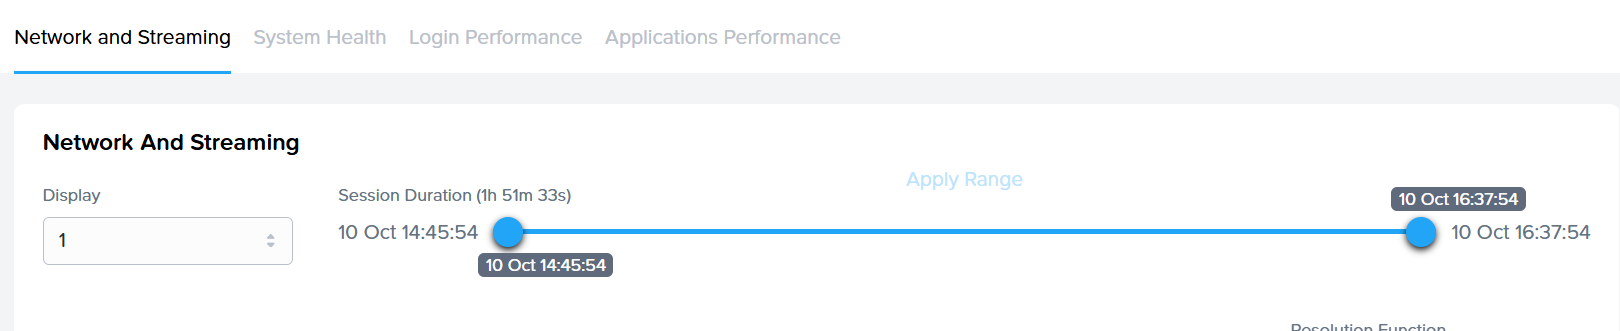
## Session Analytics
Dizzion Overwatch is the built-in, always-on **observability** and **analytics** layer for Dizzion DaaS and Cloud PC. Overwatch gives IT admins a digital compass and real-time map, enabling deeper visibility, faster diagnostics, more intelligent planning, and more confident decisions to continue delivering the best user experience. Value of Dizzion Overwatch:
- Troubleshoot faster: Quickly isolate login, application, or performance issues.
- Prevent incidents: Use trends and thresholds to detect and mitigate degradation before users are impacted.
- Enhance user experience: shorter logins, smoother sessions, and more responsive apps.
- Right-size infrastructure: Optimize VM sizing, pool types, and deployment strategies based on real-world usage.
- Enable more innovative planning: Align resource allocation and policy enforcement with actual telemetry and usage insights.
**Dizzion Overwatch does provide insights in**
- Network and Streaming
- System Health
- Login Performance Timeline
- Application Performance
How to use and solution details can be found in [this page](https://docs.difr.com/books/platform-administrators-guide/page/dizzion-overwatch-session-analytics-overview).
[](https://docs.difr.com/uploads/images/gallery/2025-10/NToimage.png)
### Close session
Administrators can close active sessions from this page as well by selecting the option within the kebab menu.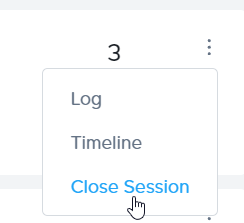
*Sessions - Close Session*### Download Session Data
Lastly, you can download the session data in CSV format by clicking the download icon at the top of the page. The CSV will provide all session details for the time frame specified to the left of the download link.
*Sessions - Download CSV*
Column
Details
**Session ID**
Unique identifier for the session. Important to provide when discussing a user session issue with Frame Support.
**Workload ID**
Unique identifier for the server used by the session. Important to provide when discussing a session or server issues with Frame Support.
**First Name**
First name of the session's user, as provided by a [third-party identity provider integration](https://docs.difr.com/books/platform-administrators-guide/page/identity-and-access), [Basic Authentication](https://docs.difr.com/books/platform-administrators-guide/page/basic-authentication), or if specified in a [Secure Anonymous Token (SAT)](https://docs.difr.com/books/platform-administrators-guide/page/secure-anonymous-tokens) request.
**Last Name**
Last name of the session's user, as provided by a [third-party identity provider integration](https://docs.difr.com/books/platform-administrators-guide/page/identity-and-access), [Basic Authentication](https://docs.difr.com/books/platform-administrators-guide/page/basic-authentication), or if specified in a [Secure Anonymous Token (SAT)](https://docs.difr.com/books/platform-administrators-guide/page/secure-anonymous-tokens) request.
**Identity Provider**
Name of the Identity Provider(IdP) used by Frame.
**Email**
The email address of the session's user, as provided by a [third-party identity provider integration](https://docs.difr.com/books/platform-administrators-guide/page/identity-and-access) or [Basic Authentication](https://docs.difr.com/books/platform-administrators-guide/page/basic-authentication).
**IP Address**
IP address from where the session start request originated (Usually the IP address of the system where the browser started the session).
**City**
Geolocated city from where the session start request originated, derived from the user's IP address.
**Distance**
Distance in miles from the originating request's geolocation to the workload VM's geolocation.
**System**
The pool type used for the session (e.g., Production, Sandbox, Utility).
**Instance Type**
Name of the instance type for this workload VM. Instance type names are specific to the underlying infrastructure. In the case of AHV, the instance type name will be the name you defined under the [AHV Cloud Account](https://docs.difr.com/books/platform-administrators-guide/page/cloud-accounts). This name corresponds to the name of the pool in Capacity.
**Ram Memory**
Amount of RAM allocated to the instance type.
**vCPU**
Number of virtual CPUs available to the instance type.
**GPU**
GPU identifier for the instance type/infrastructure.
**State**
Current state of the session (e.g., 'closed').
**Start**
Time when the user was connected to a virtual machine using Frame Remoting Protocol (UTC or local time of administrator's endpoint).
**End**
Time when the user's session finished, after post-session processes (UTC or local time of administrator's endpoint).
**Duration**
Elapsed time in seconds from the start to the close of the session.
**Bandwidth Fields (Multiple)**
Min, average, and max bandwidth values consumed during the session.
**Frame Rate Fields (Multiple)**
Min, average, and max frame rate values during the session.
**Latency Fields (Multiple)**
Min, average, and max latency values measured during the session.
**Metadata**
Metadata passed into a session from the User's token (SAT or from IdP), set when the token is generated.
**Launchpad ID**
The Launchpad ID utilized when initiating the session.
# Session Shadowing
The Session Shadowing feature allow admins to connect to a user session to observe the user's primary display and control the mouse and keyboard, as necessary.
## Prerequisites
- Frame Remoting Protocol 8
- Frame Server 9.0.4.0 or greater
- For Tech Preview, Dizzion Support must enable the feature at the Customer entity level.
## Limitations
- Only users with the Customer, Organization, or Account Administrator role can initiate a session shadow.
- Users are notified when an admin begins shadowing their sessions. However, there is no option for users to accept or reject the administrator from shadowing their session.
- Admins will have the ability to control the keyboard and mouse of the session.
- Windows OS VMs only.
## Administrator Experience
1. To Shadow an active end-user session, go to the Frame Account Dashboard and navigate to **Status** > **Active Sessions** tab.
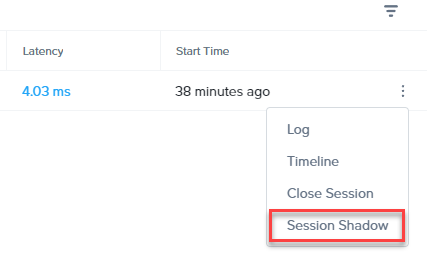
2. Locate the active session you wish to shadow and click on the kebab menu.
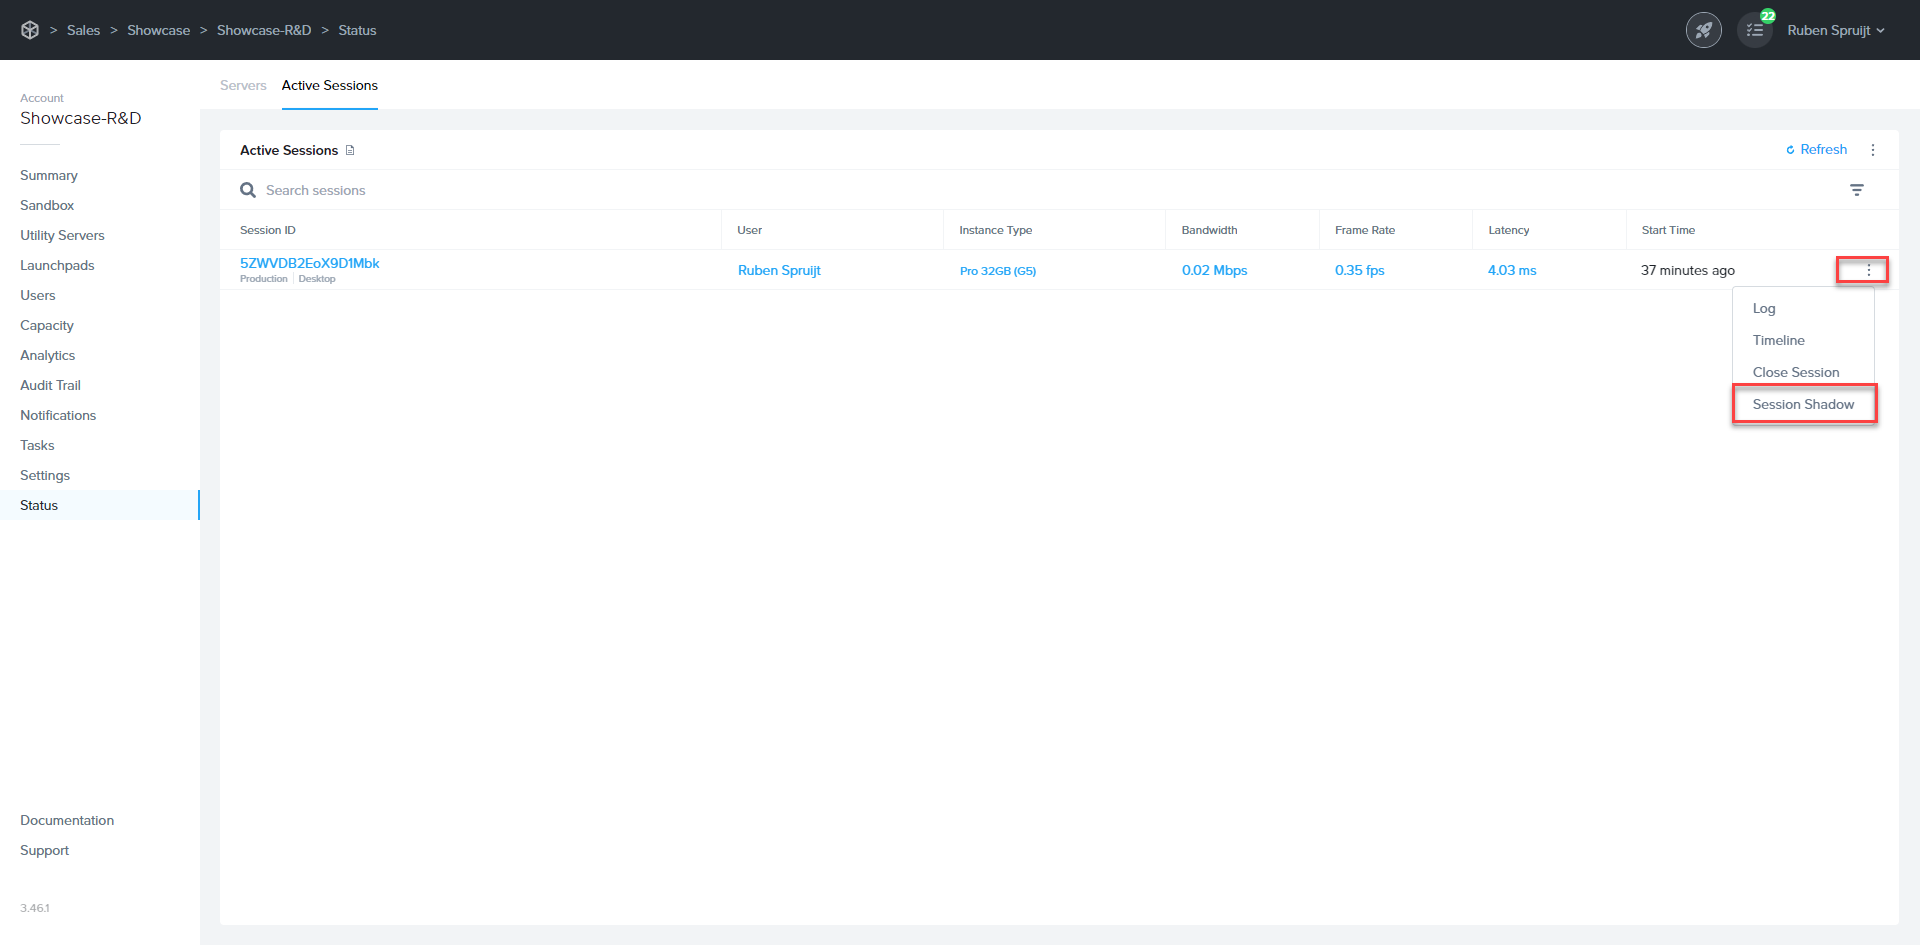
3. Click on Session Shadow.
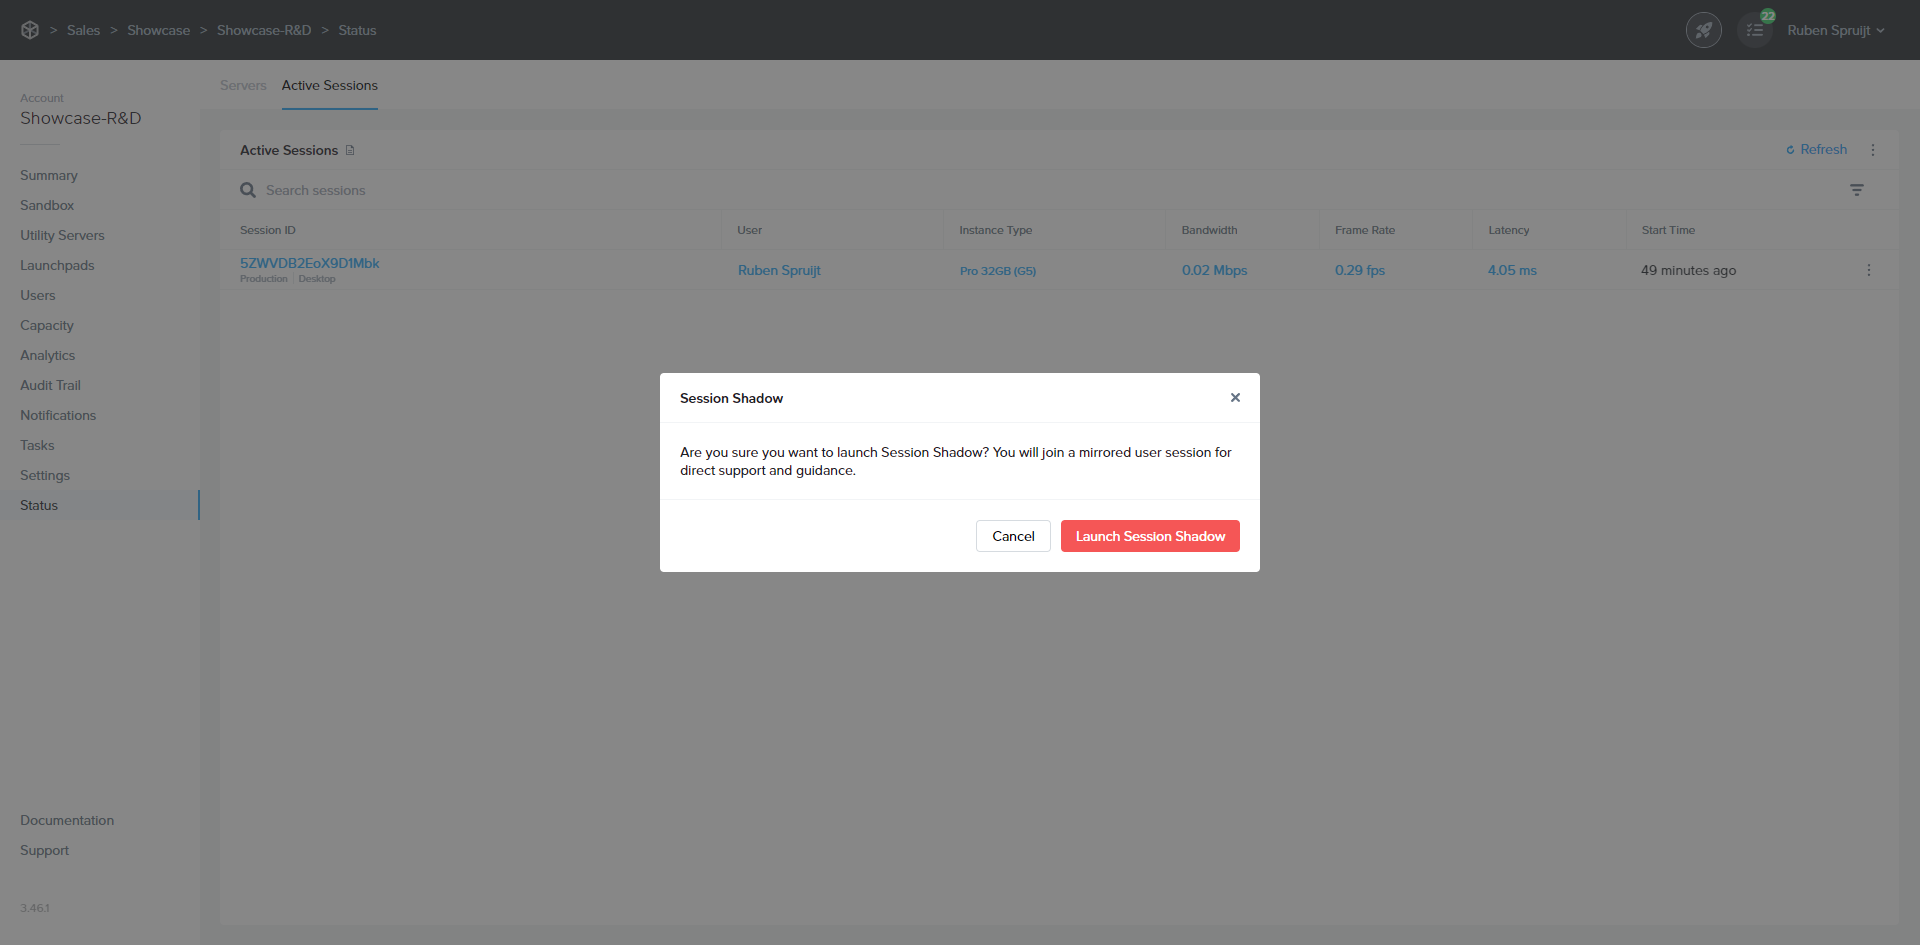
4. A prompt will appear requesting you confirm that you wish to **Launch Session Shadow**.
5. You should now be connected to the primary display of the user's session. You may see gray bars in your Frame Terminal if your display resolution differs from the user's display resolution. The user's display resolution sets the session display resolution for both the user and the administrator. Frame Terminal will display a message explaining the reason for the gray bars.

6. To close the Session Shadow, go to the Frame Gear menu and click on **Disconnect**.
## User Experience
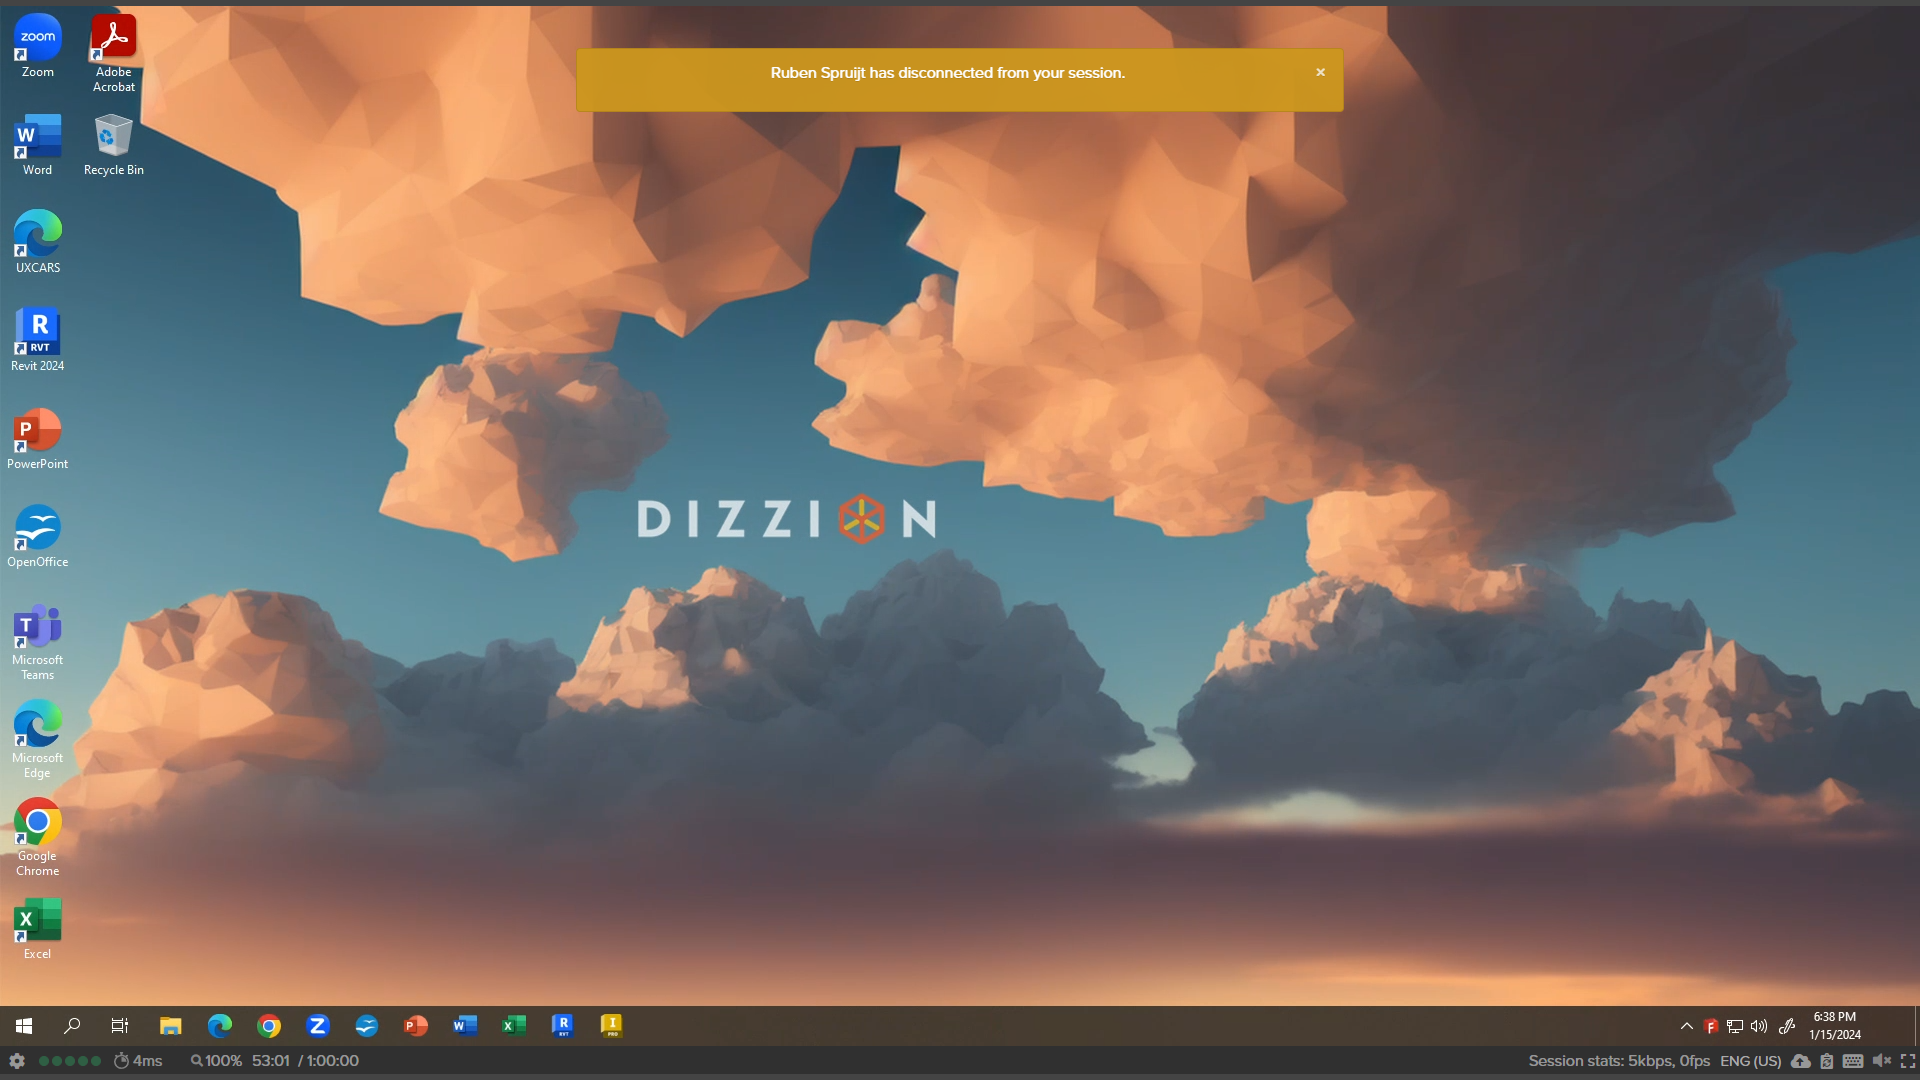
When the administrator has established a session into the user's session, the user will see a banner at the top of their display, notifying the user that an administrator is now viewing their session.

When the administrator disconnects from the user's session, the user will see a banner at the top of their display, notifying the user that the administrator has left their session.
# Dizzion Overwatch - Session Analytics - Overview
Dizzion Overwatch is the built-in, always-on observability and analytics layer for Dizzion DaaS and Cloud PC. Overwatch gives IT admins a digital compass and real-time map, enabling deeper visibility, faster diagnostics, more intelligent planning, and more confident decisions to continue delivering the best user experience.
### How is Dizzion Overwatch different from other DEX solutions
Digital Employee Experience (DEX) tools deliver observability and analytics, but they come with trade-offs: third-party licensing, integration complexity, additional backend infrastructure, and costs that grow as your user base scales. Dizzion Overwatch, a solution in the DEX ecosystem, takes a fundamentally different approach. It is built into the platform itself as a native service. That means no extra infrastructure costs, firewall changes, or additional agents or installations. It meets compliance requirements, is simple to use, and delivers the observability and analytics needed for DaaS and Cloud PC without the overhead or additional costs.
So, with Overwatch, there are no third-party DEX tools required (like AWS and ControlUp), no extra paid add-on services (like Microsoft with AVD & Cloud PC), and no external data platforms or databases to license, deploy, or manage (like Citrix or Omnissa). With Overwatch, observability and analytics are built in — native, cost-efficient, and ready to use.
### What makes overwatch different from other DEX solutions?
**Modern design and no additional costs**
The Overwatch agent is embedded directly into every DaaS and Cloud PC Windows Workload VM, persistent and non-persistent applications, and desktops. As part of the Dizzion backplane it automatically capturing a wealth of telemetry each second without needing additional agent installation or configuration.
**No infrastructure required**
Forget Splunk, databases, homegrown dashboards, or juggling load balancers, firewalls, and connectors. Overwatch is powered by Dizzion’s multi-region, multi-zone backplane and streams directly into a fully managed data lake. Our architecture is designed for scale, resilience, and compliance from day one. Instead of deploying infrastructure, maintaining stacks, or worrying about version drift across agents and connectors, Overwatch delivers observability as a native service.
**Analytics built into a single admin dashboard**
The analytics layer provides real-time insights and actionable intelligence without operational overhead. What you get is a single, always-on observability layer, at this moment optimized for DaaS and Cloud PC. This layer scales with your environment and provides confidence that you’re seeing exactly what’s happening across your DaaS and Cloud PC workloads and users, wherever they are, all within the modern and fresh admin dashboard.
**Deep insights, powerful analytics**
Telemetry data is captured every second, transmitted, and stored for multiple months into Dizzion’s cloud-native backplane, which resides in the US or EU per customer choice. It is governed by controls and audit logs, including customers' ability to opt out of using Dizzion Overwatch. Telemetry includes workload VM system health, Frame Remoting Protocol (FRP) streaming performance, Windows login experience, application performance, and user experience score.
Overwatch captures workload VM core system metrics such as CPU usage, memory consumption, disk I/O, and inbound/outbound network throughput. These provide immediate visibility into bottlenecks such as resource exhaustion, runaway processes, or under-allocated VMs, allowing IT teams to act before users feel the impact.
Overwatch uses FRP telemetry data and measures framerate (FPS), average and maximum compression, quantization levels (QP), estimated available and used bandwidth, network latency, packet loss, and more. This telemetry is essential for diagnosing and analyzing streaming quality in LAN and network-constrained environments, troubleshooting user experience issues, and ensuring performance matches user expectations.
Few things frustrate users more than long login times. Overwatch breaks down each login phase — from GPO execution and Windows user profile load to shell initialization and events. It gives IT teams the information they need to analyze and optimize Windows login flows.
By monitoring per-process CPU and memory usage, disk reads/writes, and network consumption, Dizzion Overwatch reveals how applications behave in real-world use. This helps with right-sizing environments, detecting misbehaving apps, and understanding application behavior.
# Dizzion Overwatch - Session Analytics - Telemetry
## Network and Streaming
*Network and Streaming telemetry data is captured by default **every second***
#### Average QPQP (Quantization Parameter) is a measure of the amount of compression applied when H.264 encodes a frame. Low QP = less compression → higher image quality → more bandwidth used. High QP = more compression → lower image quality → less bandwidth used. Average QP shows the overall balance between quality and bandwidth. A lower Average QP means the session looks sharper and cleaner, while a higher QP means the system saves bandwidth by compressing more aggressively.
#### Estimated BandwidthEstimated Bandwidth in FRP/WebRTC shows how much network capacity the connection currently has to send audio and video. WebRTC continuously measures the network and adjusts quality on the fly. If bandwidth drops, it lowers resolution or increases compression to smooth the session. If bandwidth increases, quality automatically improves.
#### FramerateFramerate (frames per second, or FPS) shows how many images are sent per second in a video stream.
#### Max Video Quantization Max Video Quantization shows the maximum compression applied to any frame during the session.
#### Network LatencyNetwork Latency measures the time it takes for data to travel between your device (using a browser or Frame App) and the Workload VM remote system — usually shown in milliseconds (ms).
#### JitterJitter measures the consistency of the network connection — specifically, how much the delay (latency) varies between packets. Even if average latency is low, high jitter means packets arrive at uneven intervals, which can cause stutters, lag spikes, or audio dropouts in a WebRTC session. Jitter = how “steady” your network connection is. Lower jitter = smoother, more stable experience.
#### Packet lossPacket Loss shows the percentage of data packets that never reach their destination during transmission.
## System Health
*Default Captured: **every 15 seconds***
- CPU (%)
- Disk Free Space (%)
- Disk Read (%)
- Disk Write (%)
- Memory (%)
- Network Receive (bps)
- Network Sent (bps)
## Windows User Login Performance Timeline
*Captured: once **at user login***
[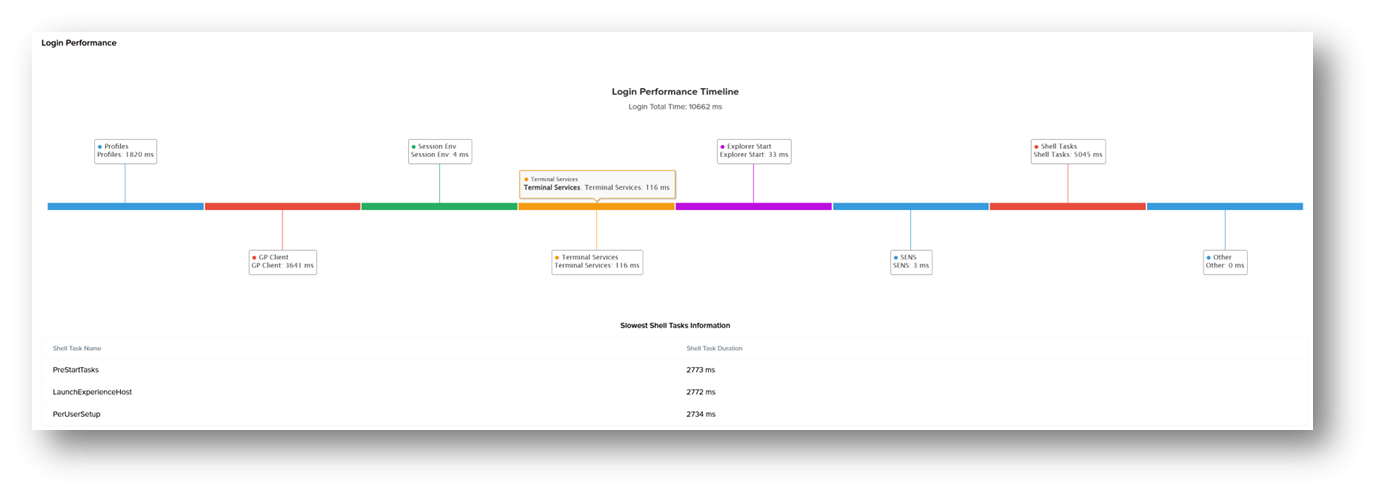](https://docs.difr.com/uploads/images/gallery/2025-10/J4vimage.png)
#### Profiles User Profile Service – loads user profile (Local/Roaming/FSlogix/Frame Enterprise Profiles)
#### GP ClientApplies machine and user Group Policies via gpsvc
*Note: Many GPOs (especially with scripts or WMI filters) slow logon. Each policy extension adds serial time.*
#### Session EnvPrepares the user’s environment — registry, variables, language packs, fonts, etc
*Note: Slow scripts or drive mappings delay this phase. Misconfigured printers or unavailable servers can hang logon.*
#### Terminal ServiceEstablishes the session layer for RDP or remoting protocols. (N/A for FRP)
#### Explorer StartLaunches the user shell (explorer.exe).
*Note: Startup apps, shell extensions, and context menu handlers delay desktop readiness. Third-party agents (AV, monitoring, OneDrive, Teams AutoStart) often extend this phase.*
#### SENS (System Event Notification Service)Signals system and application services that the user has logged in
*Note: Notifies dependent services (e.g., Task Scheduler, Network Location Awareness, etc.).Used by apps that auto-launch “on logon” events.*
#### Shell TasksExecutes post-logon initialization tasks inside the shell.
*Note: Runs background tasks from Run, Startup, and RunOnce registry keys. Starts tray icons, syncs clients, antivirus UI, updates agents, etc.*
#### OtherEverything else not classified above.
*Note: Security audits, custom scripts or third-party logon agents. Delayed background processes*
## Application Performance
*Default Captured: **every 17 seconds***
- CPU (%)
- Disk (Disk Read and Disk Write) (ops)
- Memory (mbps)
- Network (TCP recv and TCP sent) (bps)